
When the National Climate Assessment was released last fall, a massive barrage of hysterical propaganda came with it – like this article in The Atlantic saying we are all going to burn up, based on an increase in US heat waves since the 1960s.
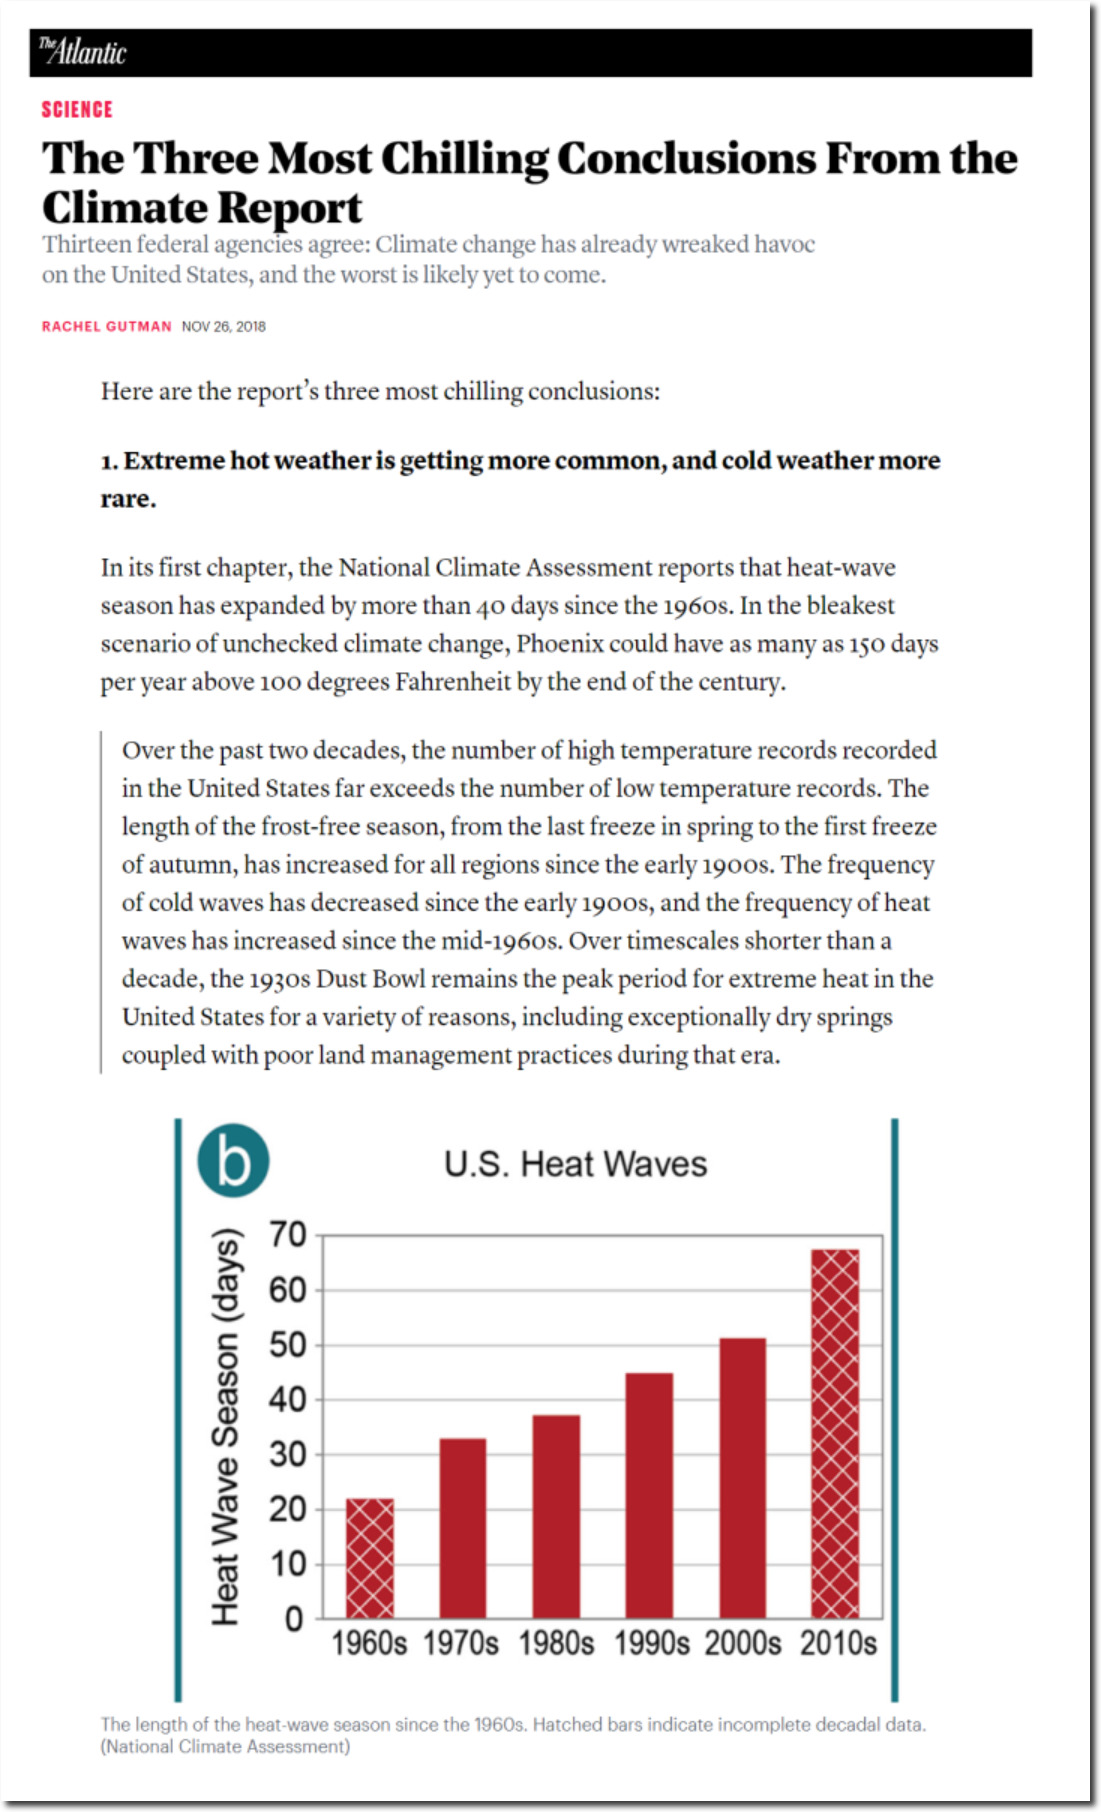
The Most Chilling Parts of the 2018 Climate Assessment – The Atlantic
The graph was taken from page 38 of the Fourth National Climate Assessment document released in November 2018.
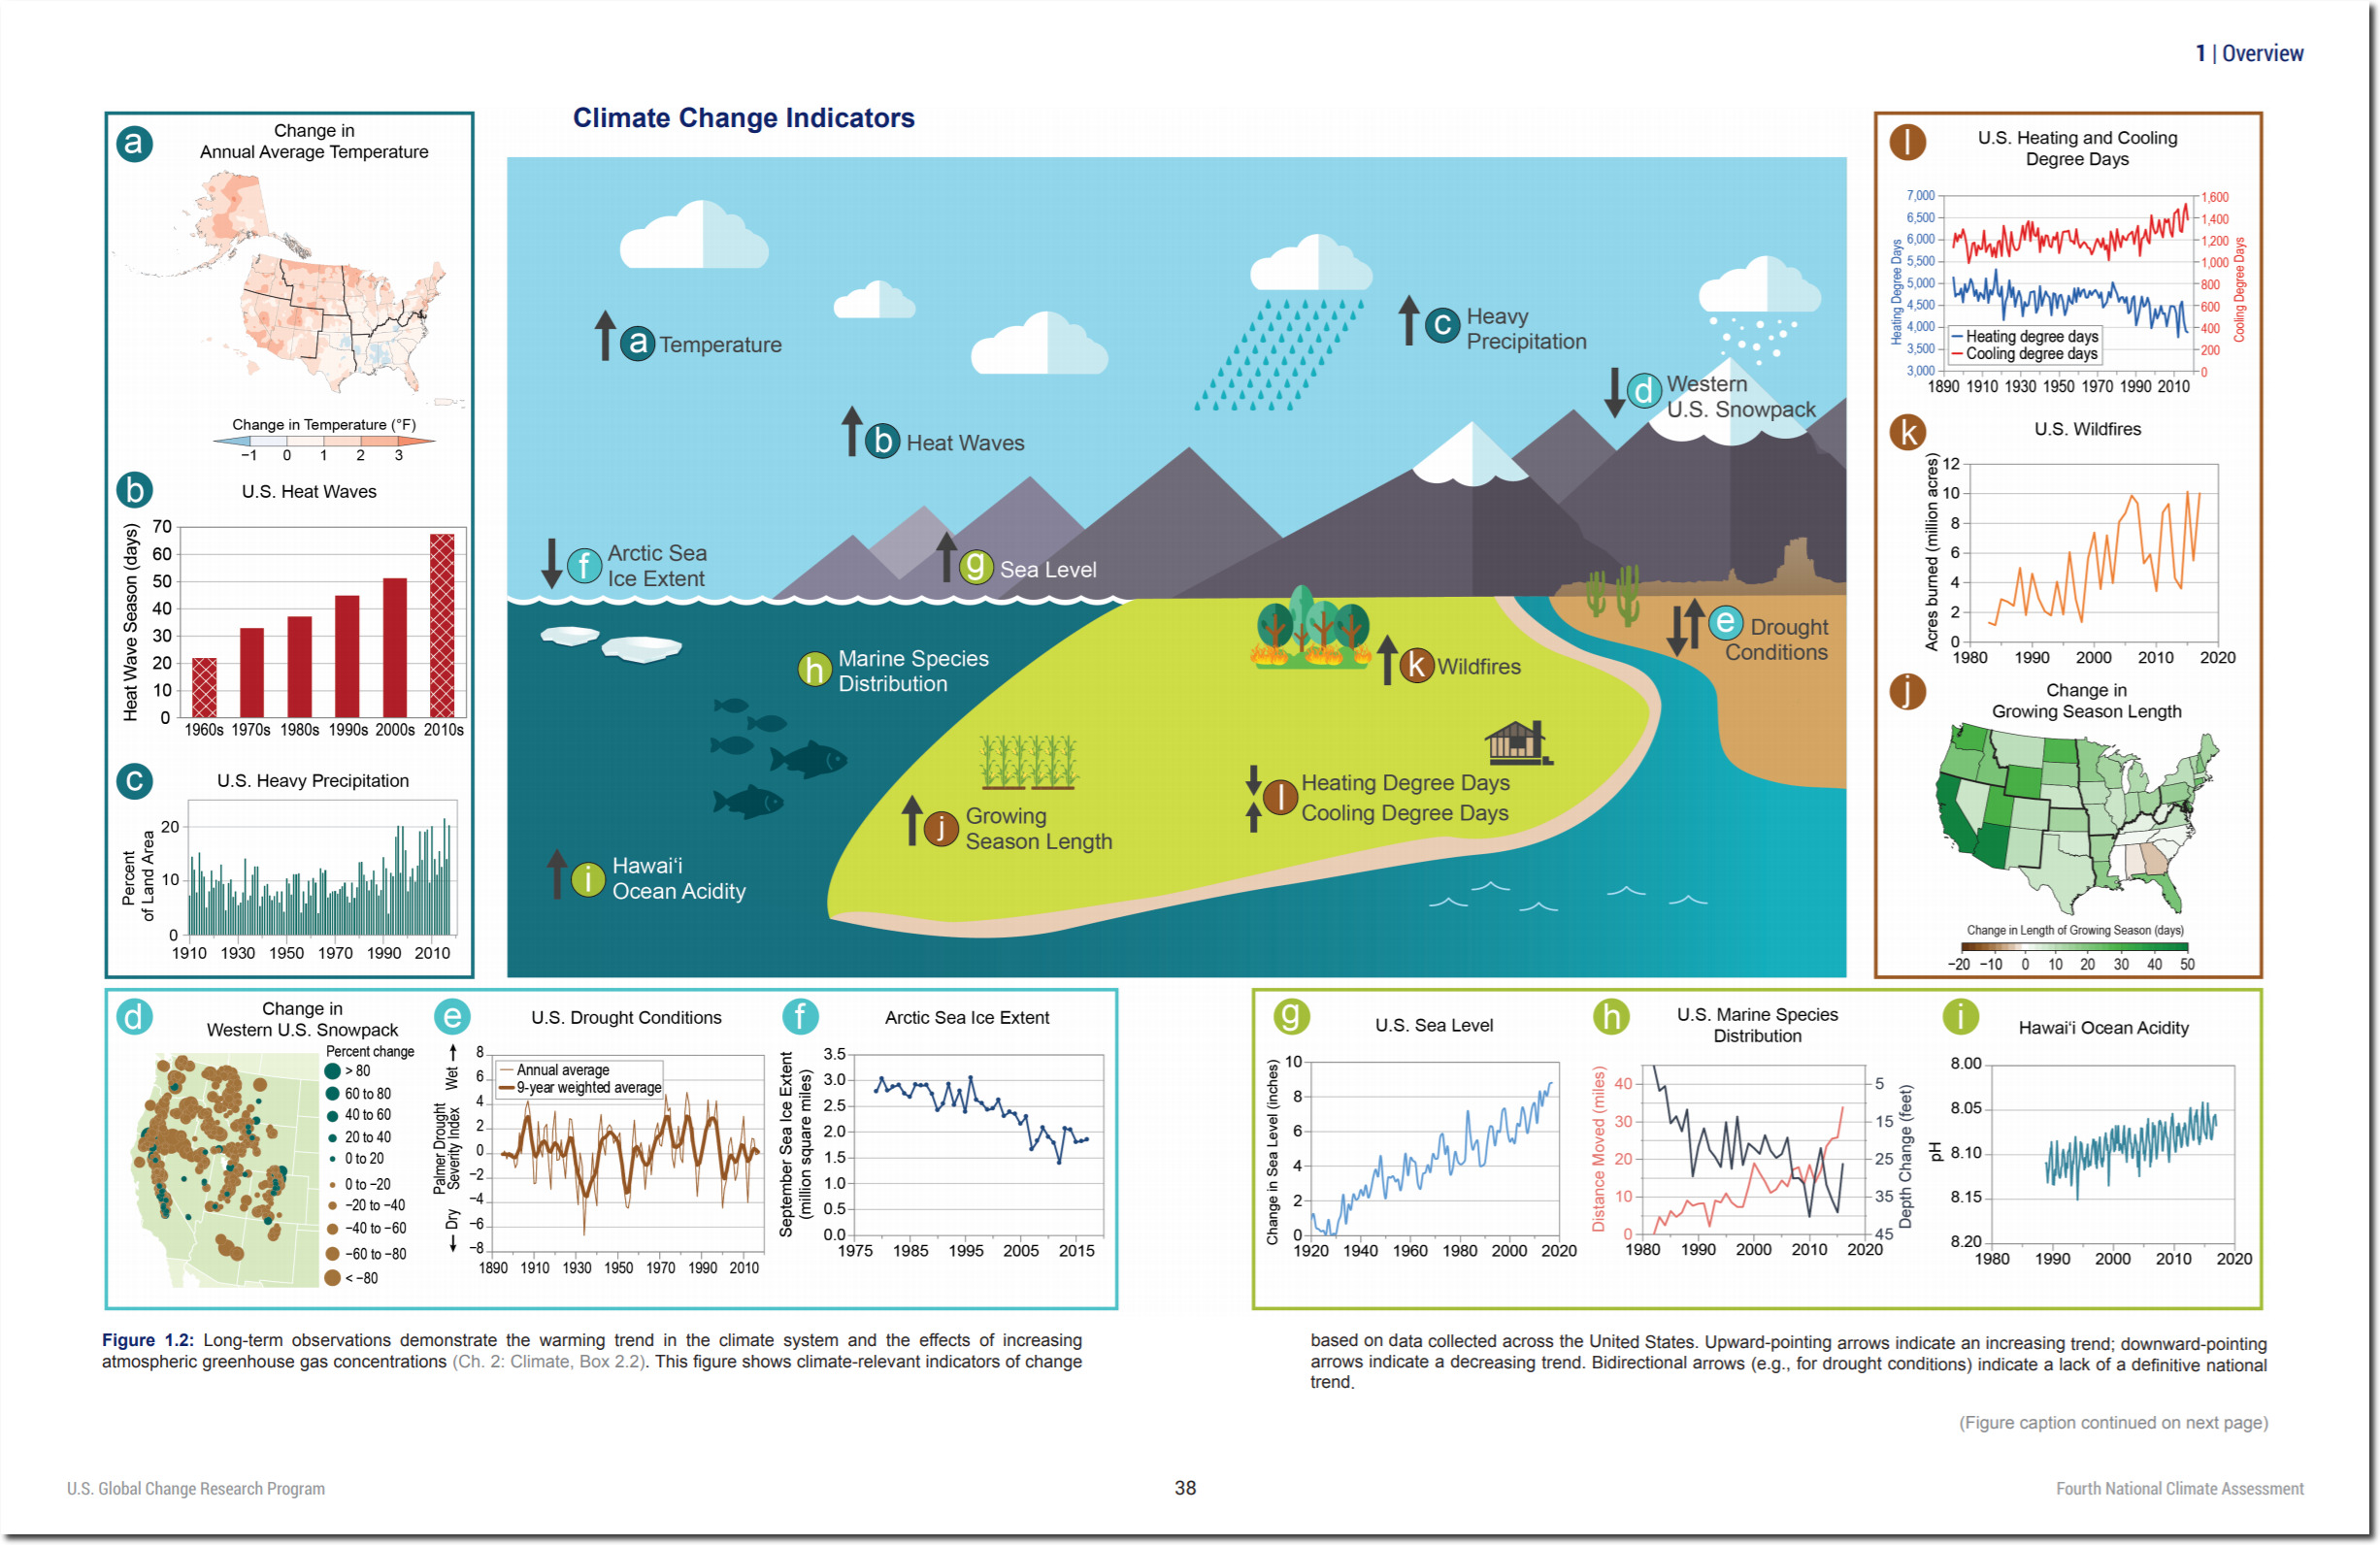
Fourth National Climate Assessment, Volume II: Impacts, Risks, and Adaptation in the United States
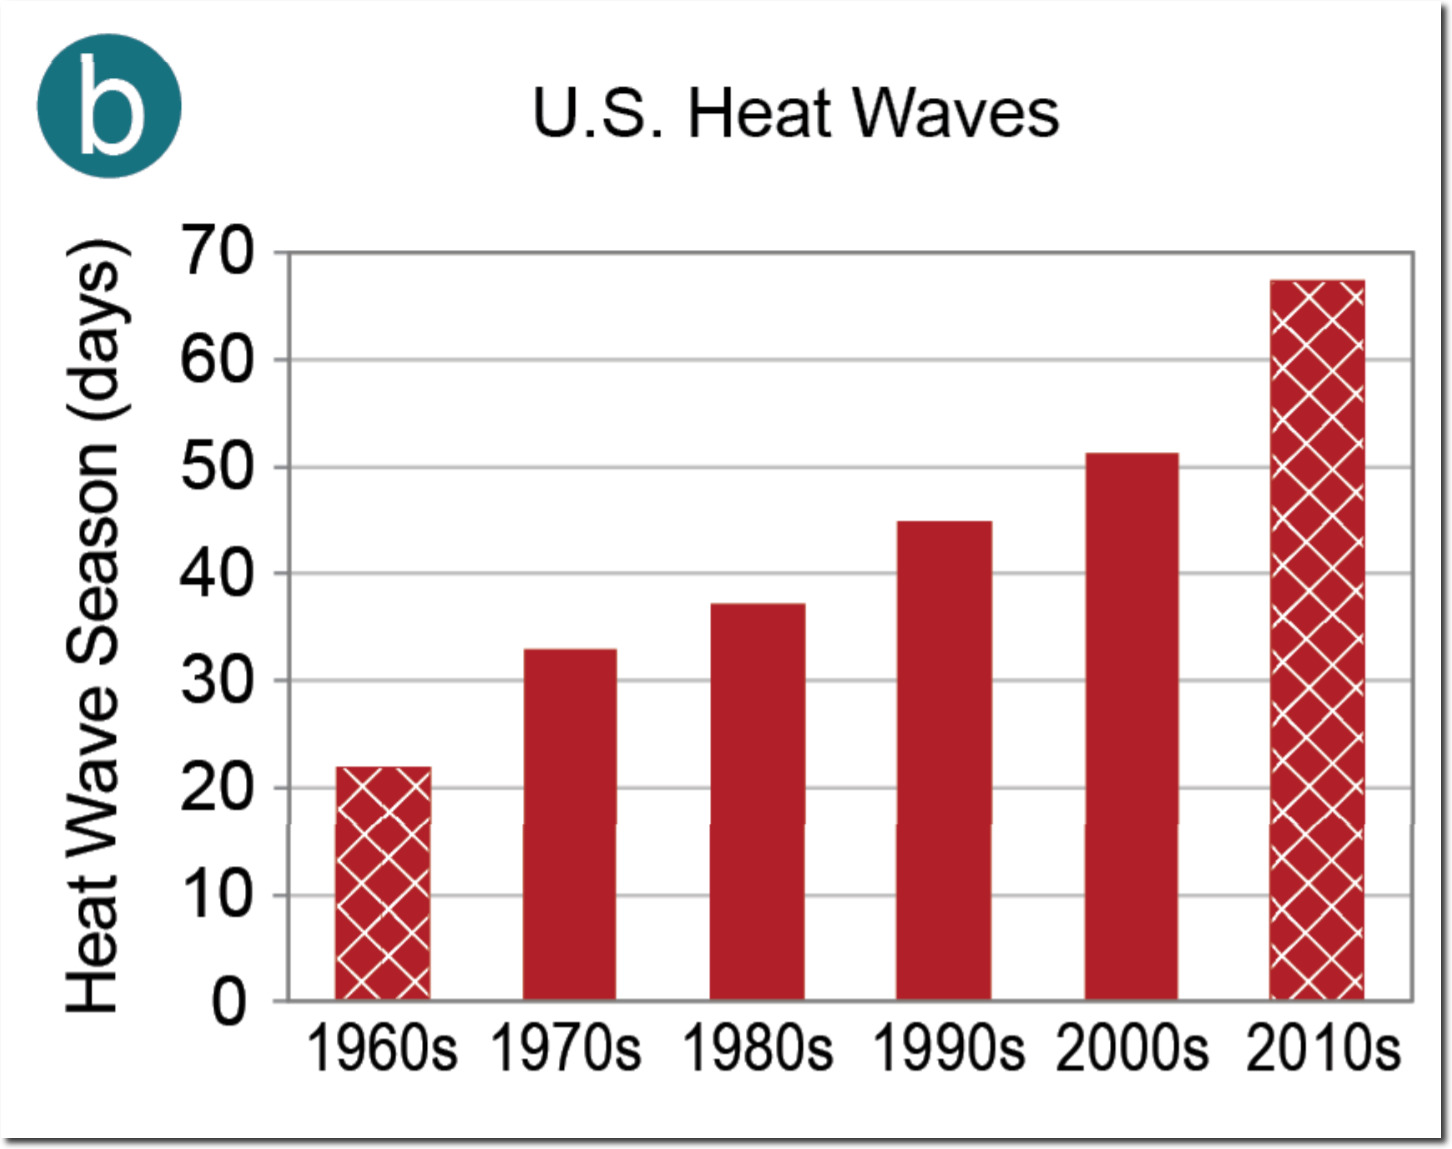
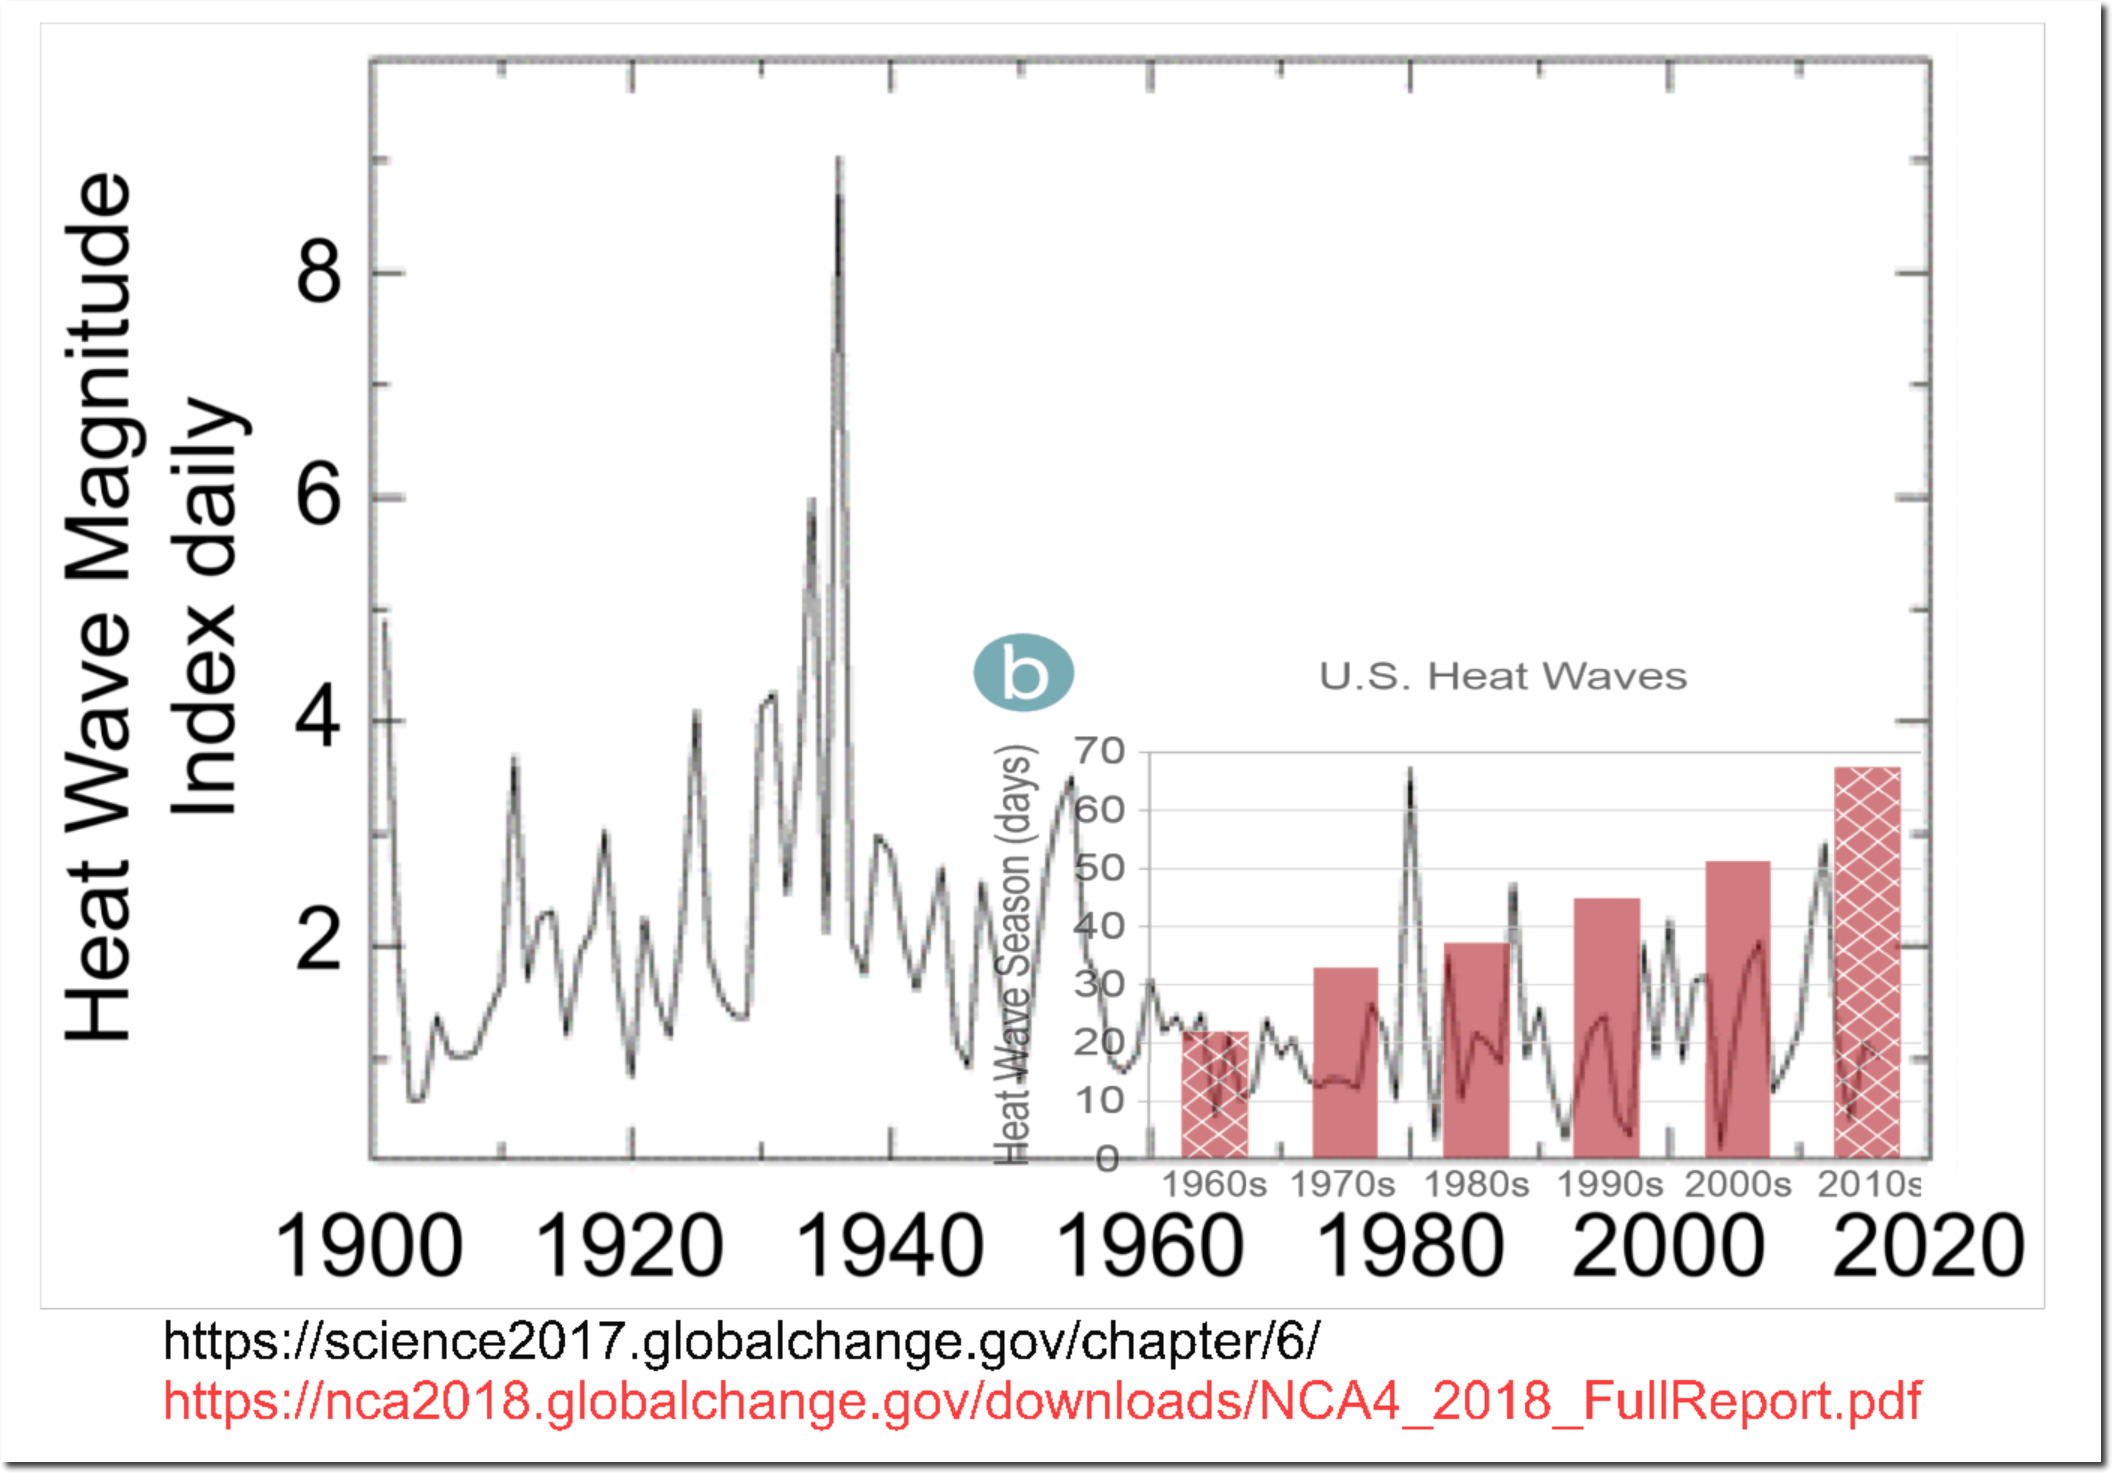
But why did they choose the 1960s for their start date? The US has excellent temperature records going back the late 19th century, and in fact the 2017 National Climate Assessment showed heat wave data going back to 1900. The 2017 data showed unambiguously that US summers were much hotter prior to 1960, and that the 1960s and 1970s had the fewest heatwaves of any period in the US. This very important data was excluded from the 2018 report.

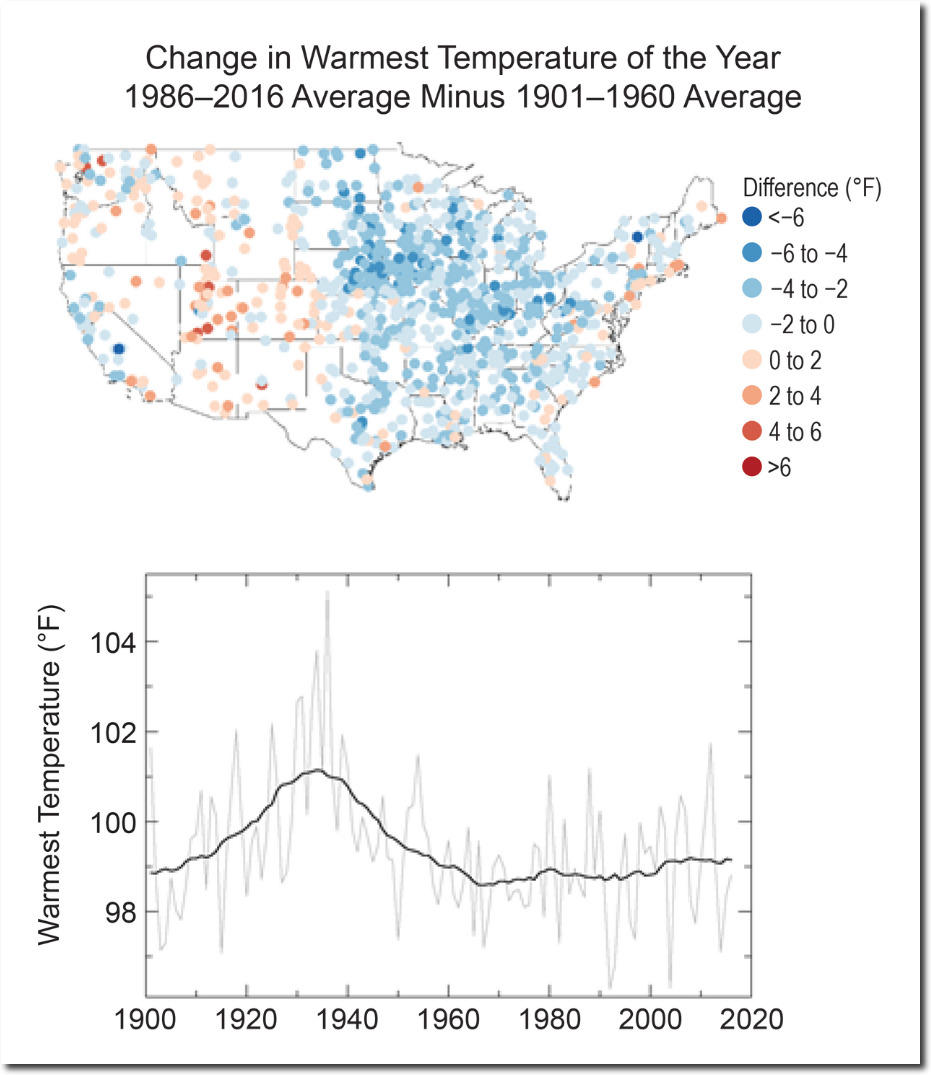
Temperature Changes in the United States – Climate Science Special Report
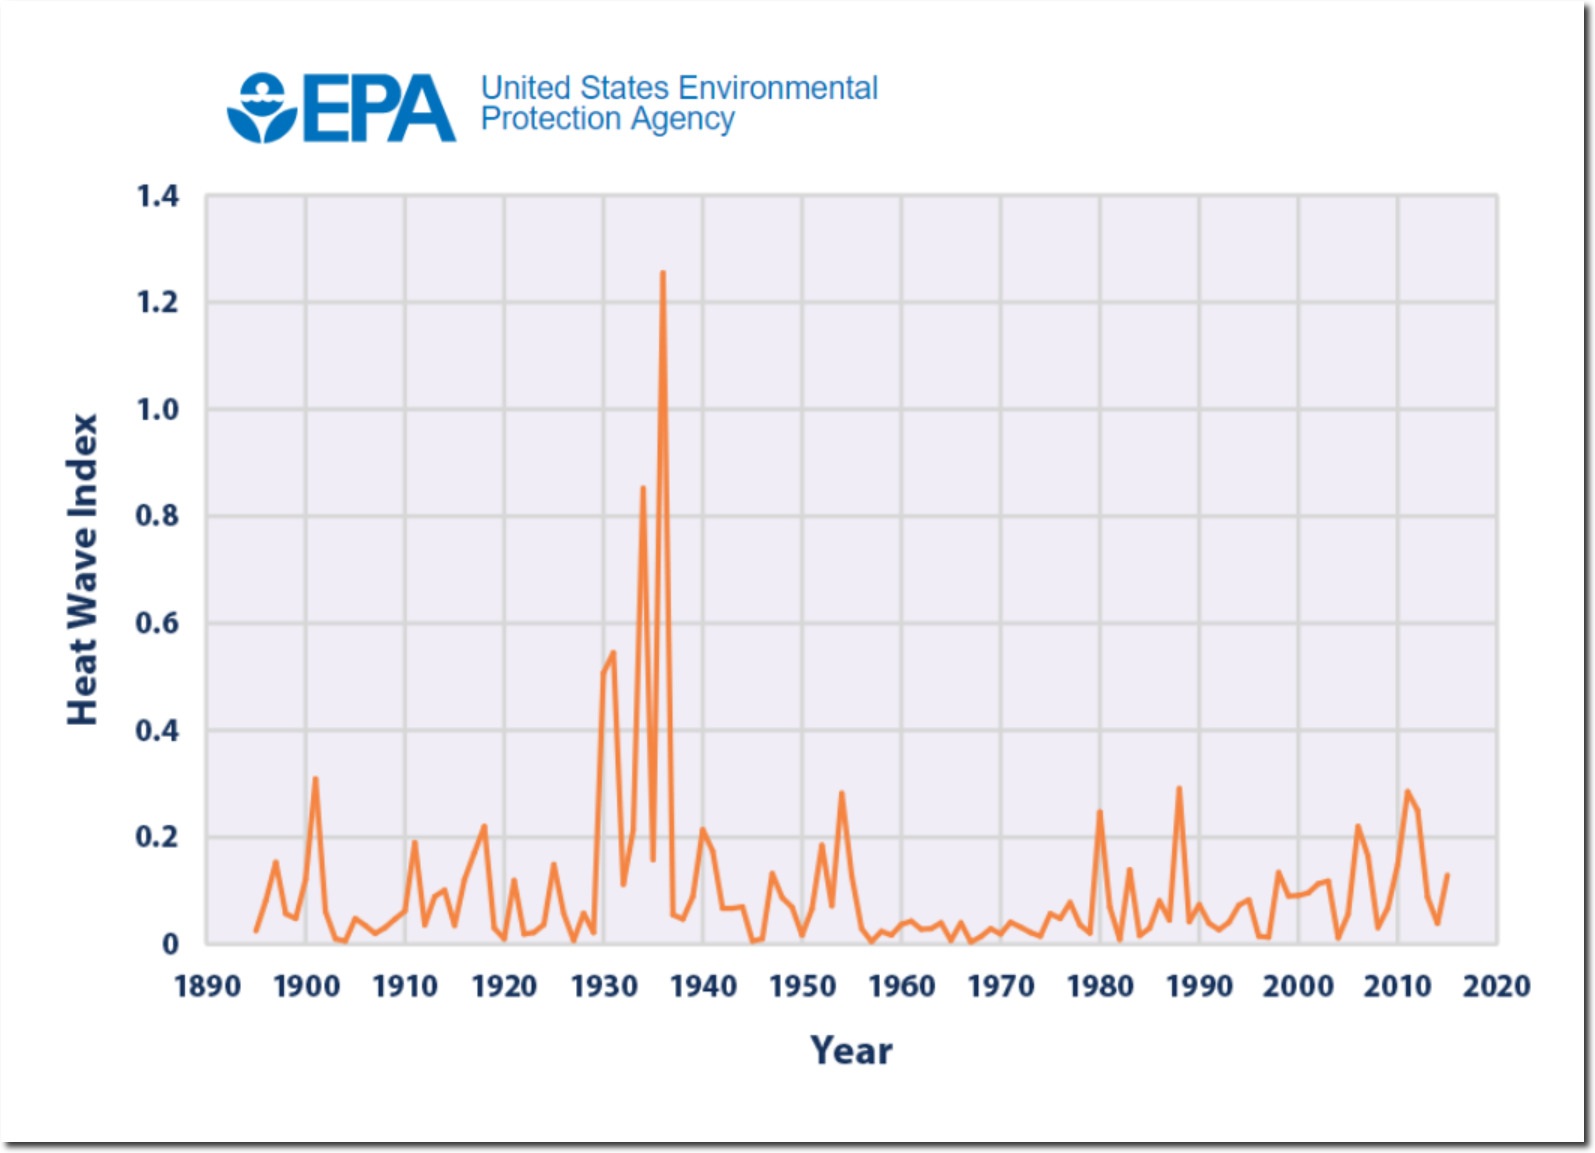
Data from the EPA shows the same thing.
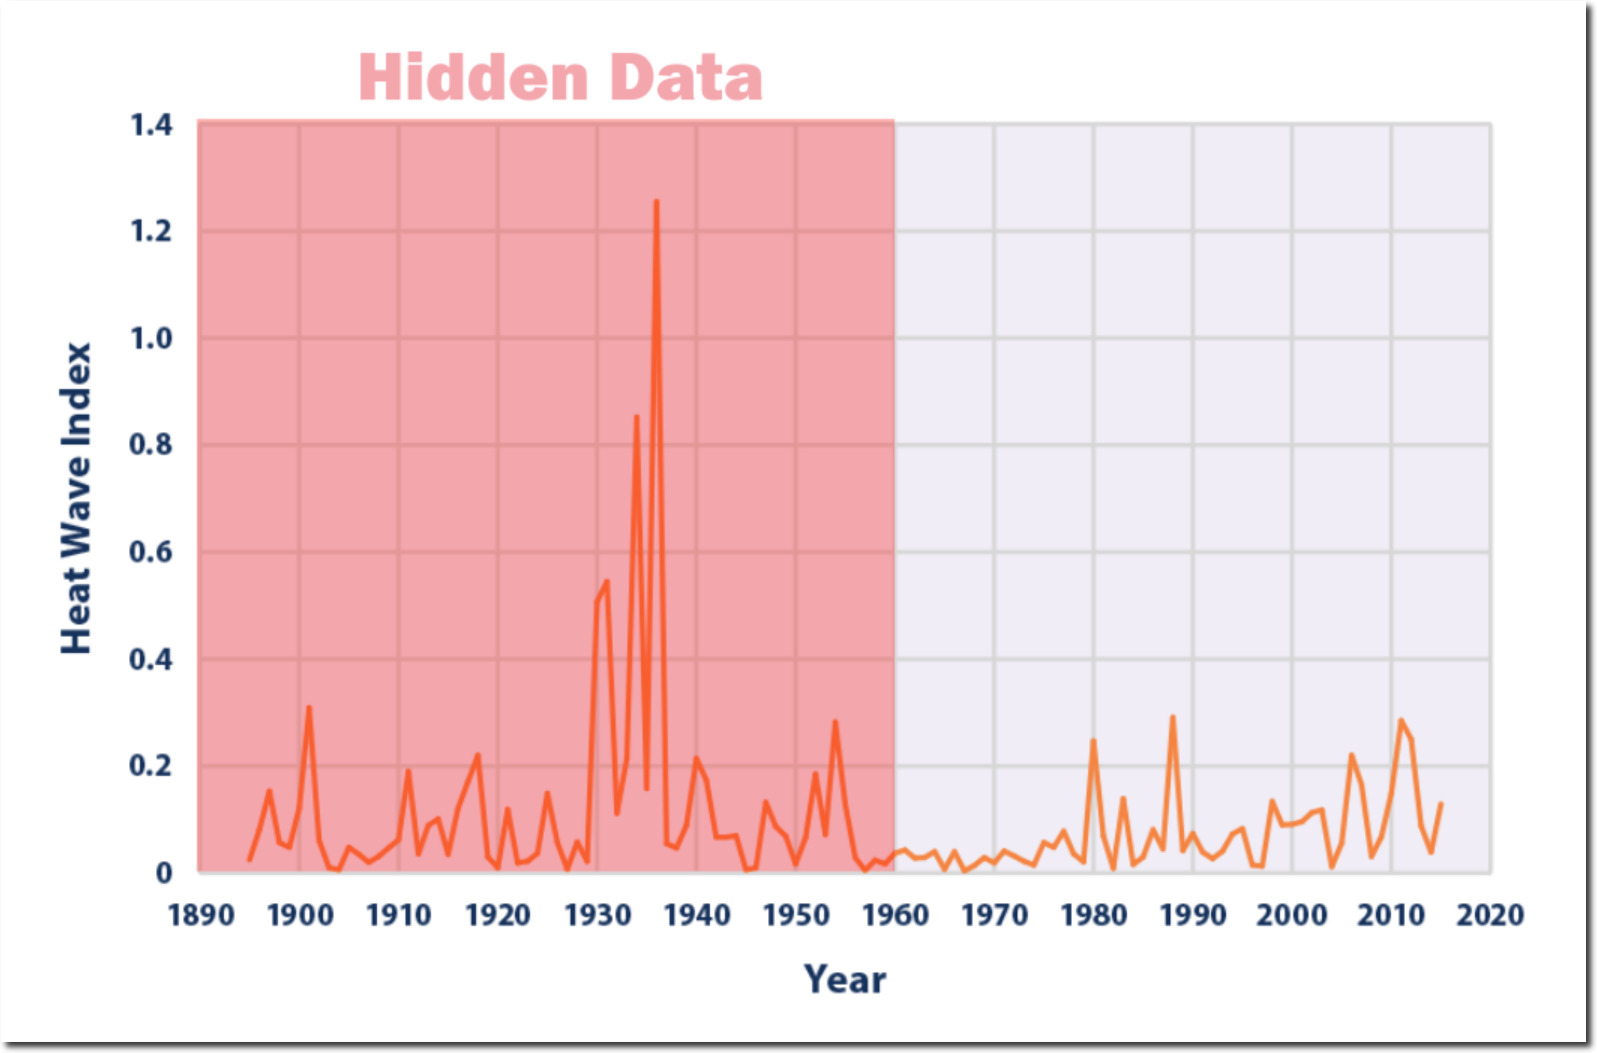
I overlaid the 2018 NCA graph on the 2017 NCA data, and it becomes very clear what they are doing. The 2018 report released to the public, cherry-picked the only start date in the graph which they could use to create the appearance of a warming trend.
Here is the same overlay with the EPA graph – once again showing the extreme fraud in the 2018 NCA document.

The next two graphs show the very hot pre-1960 weather which is being hidden in the 2018 NCA report.

Reality is the exact opposite of what is claimed in the Atlantic article and the 2018 National Climate Assessment report. The frequency of hot days has plummeted in the US over the past century.
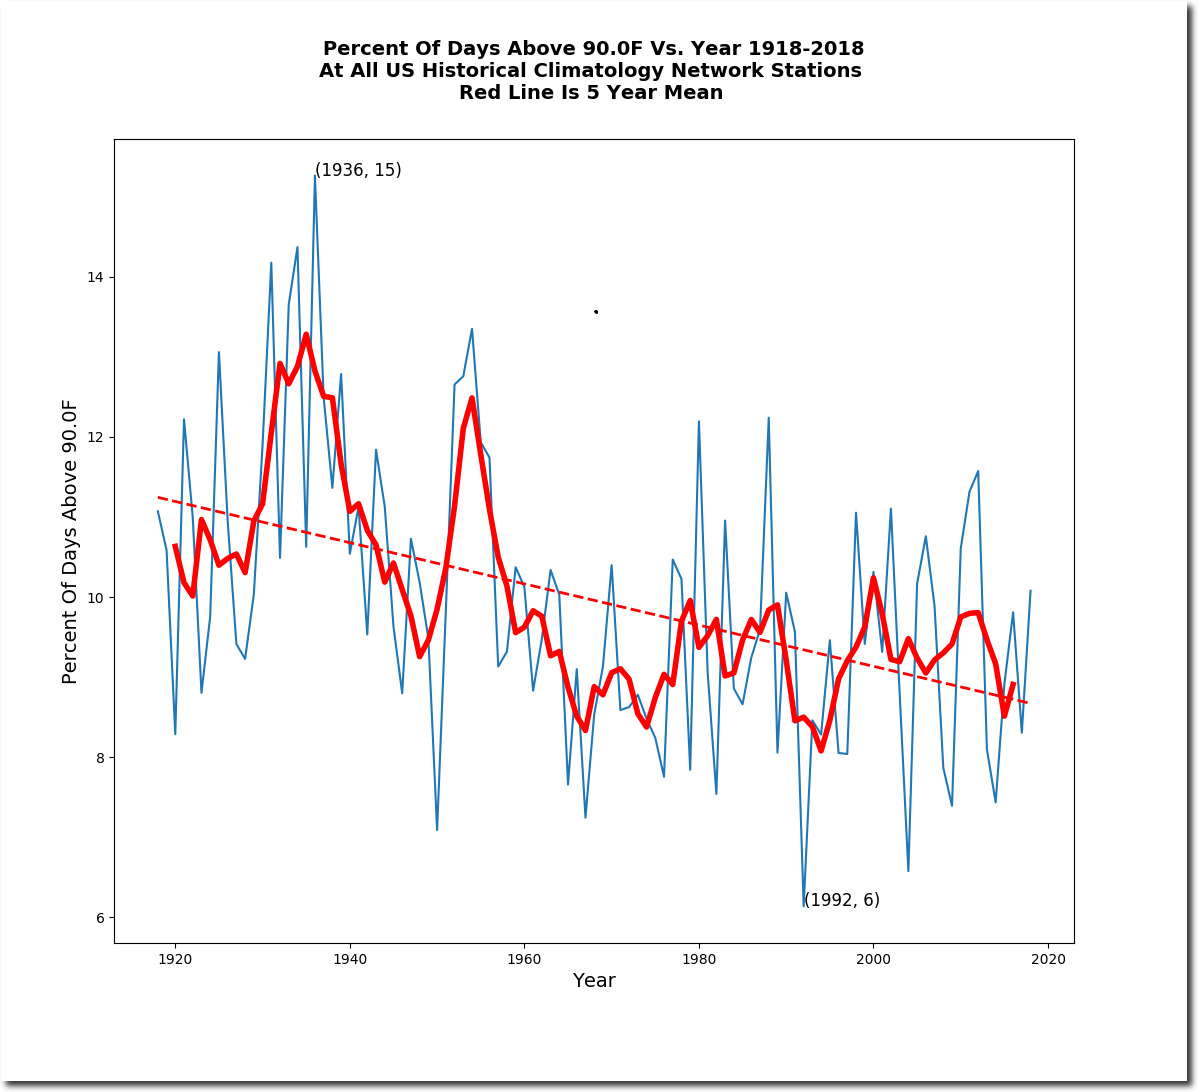
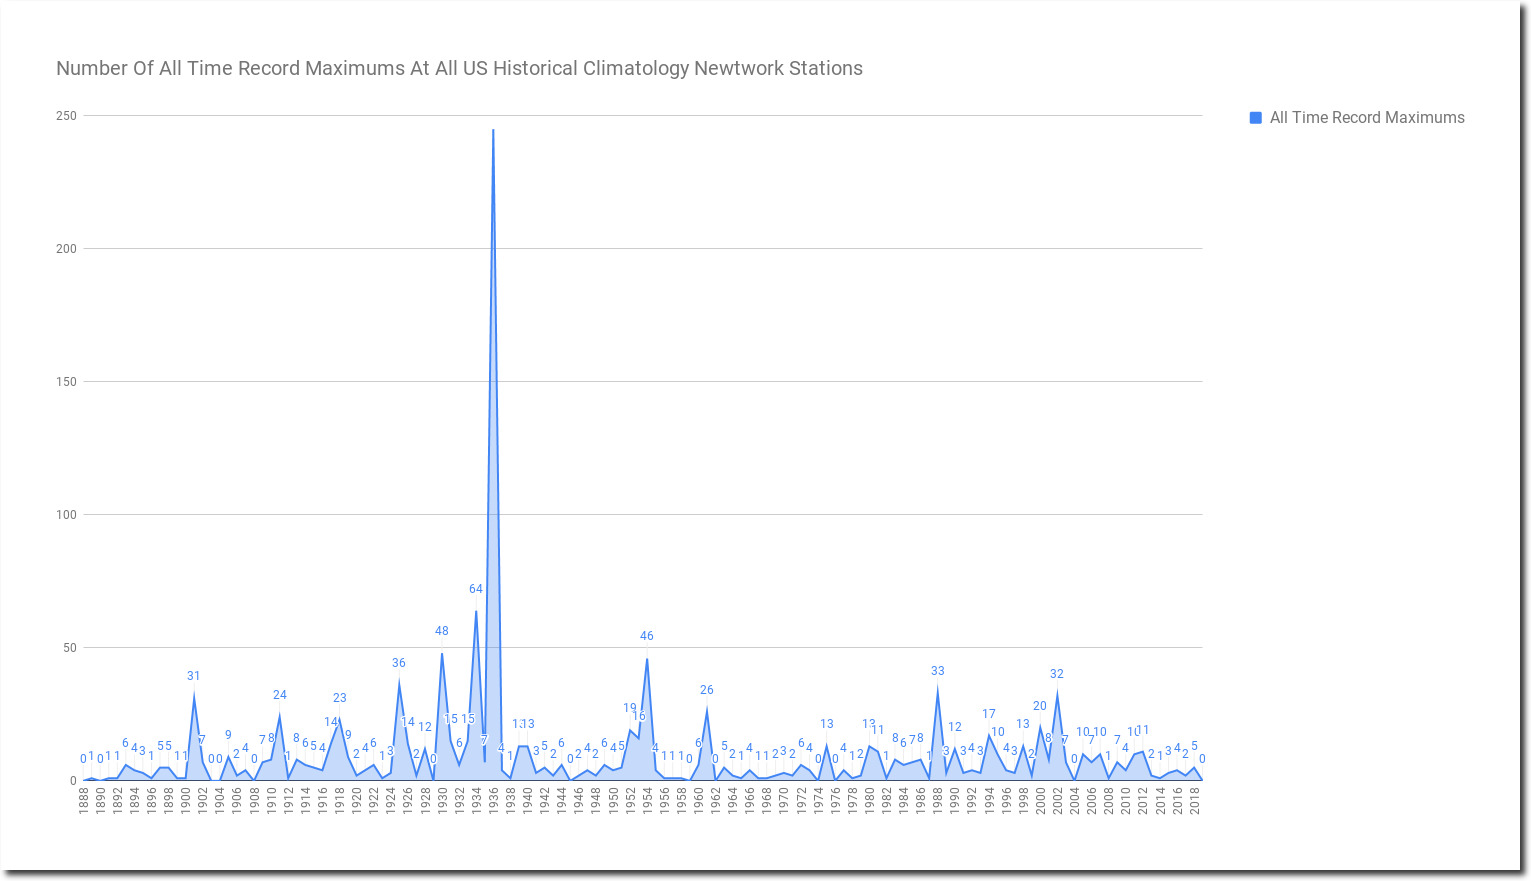
The number of all-time record maximum temperatures peaked in the US in the 1930s, and bottomed in the 1960s when then the NCA started their graph.
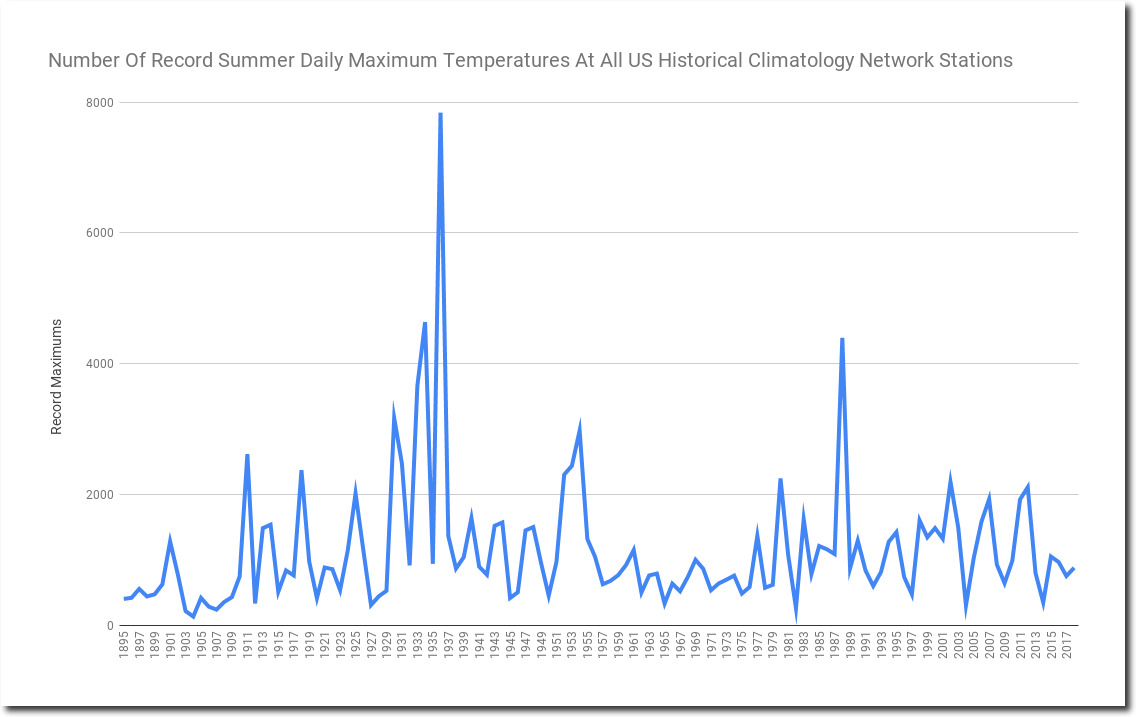
The number of record daily maximum temperatures in the US peaked in the 1930s, and bottomed in 1960’s, when the NCA started their graph.
The 1930s were extremely hot, and thousands of people died in the heat.

The Bulletin – Google News Archive Search
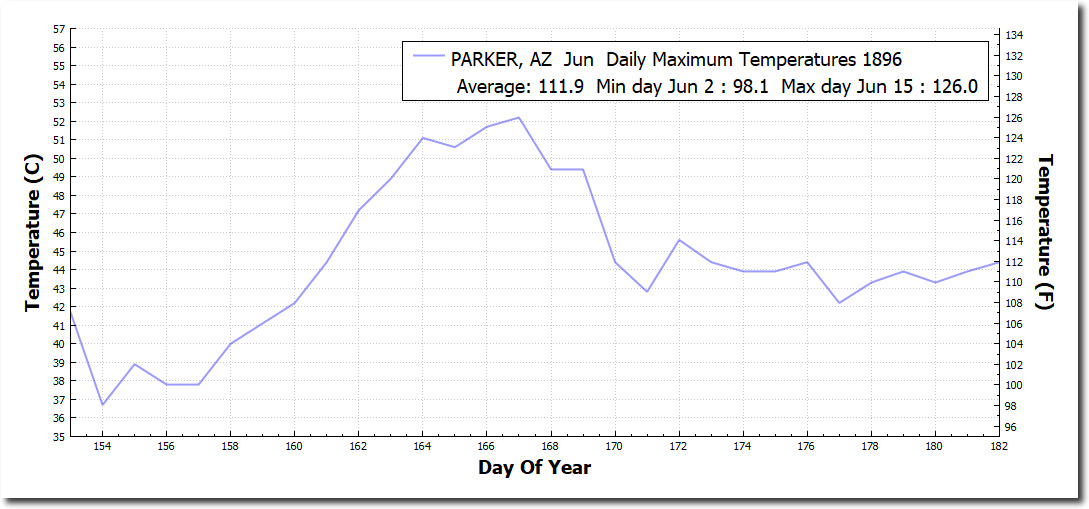
Same story in 1896.
During June 1896, Parker, Arizona had seven consecutive days over 120 degrees – a record which was only matched in 1905. Since 1960, the longest stretch of days over 120 degrees in Arizona is three.
The 1896 heat was not confined to the US. January, 1896 was the hottest month on record in New South Wales, Australia. Bourke averaged 110 degrees that month.
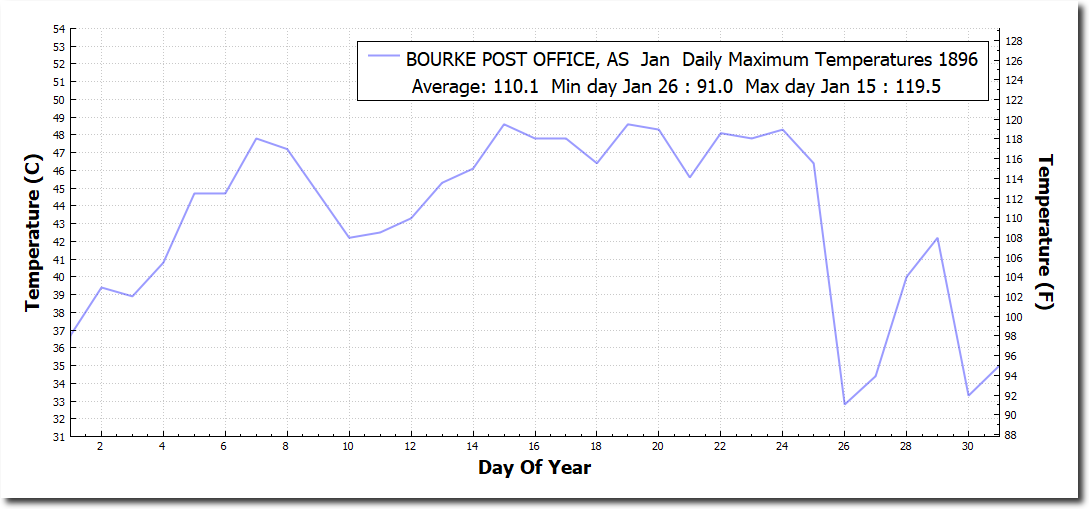
The Australian heatwave of January, 1896 was much hotter than this year’s claimed record heatwave. Like in the National Climate Assessment, the Australian Bureau of Meteorology hides all inconvenient hot temperatures prior to 1910.

The 1930s heat was also not confined to the US, with glaciers rapidly melting in Greenland, North America and Europe.

17 Dec 1939, Page 15 – Harrisburg Sunday Courier
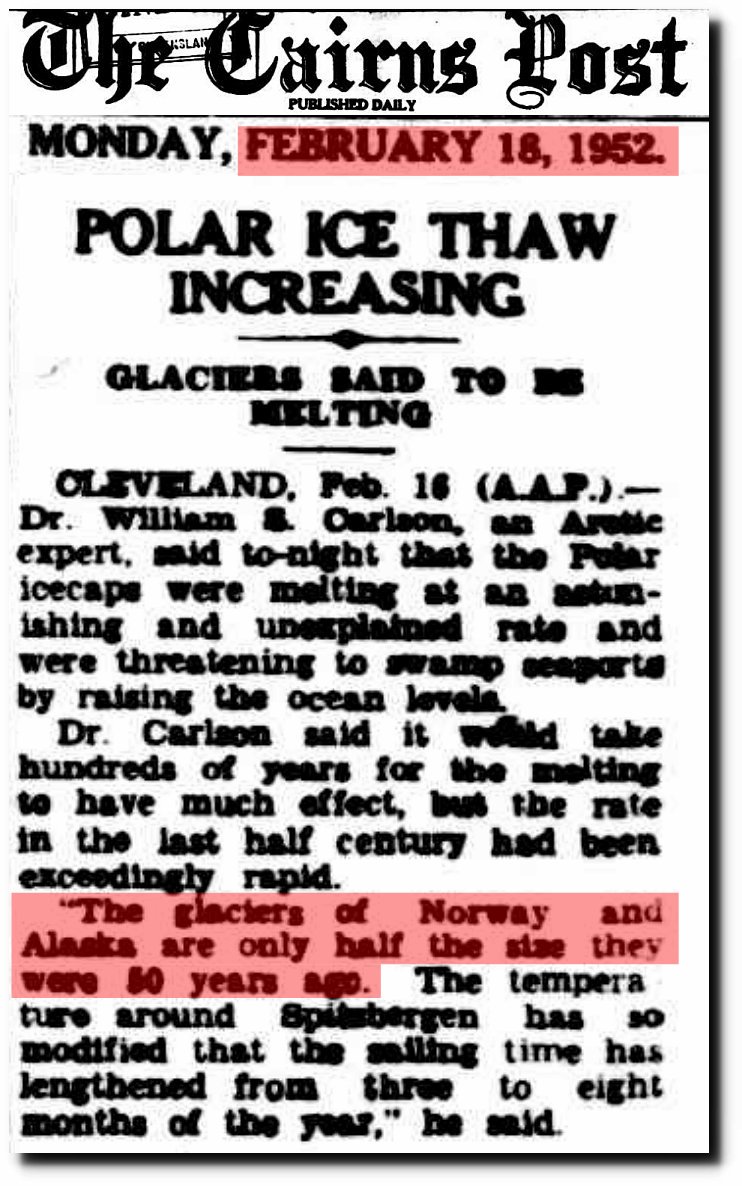
18 Feb 1952 – POLAR ICE THAW INCREASING
By 1954, Spitzbergen had warmed 18 degrees.
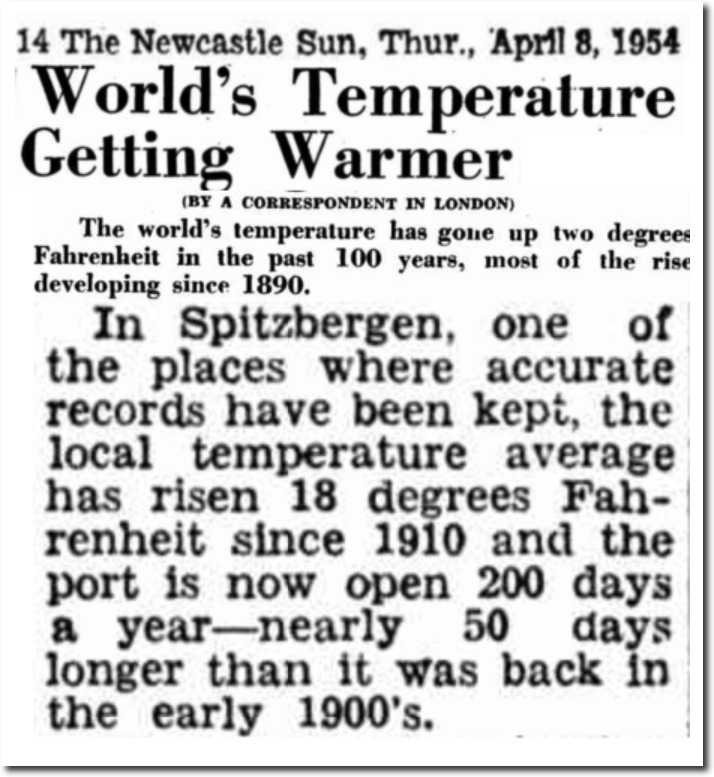
08 Apr 1954 – World’s Temperature Getting Warmer
But the warmth of the 1930s and 1940s, turned rapidly into cooling, and by the 1960s there was unanimous consensus the Earth was cooling.

U.S. and Soviet Press Studies of a Colder Arctic – The New York Times
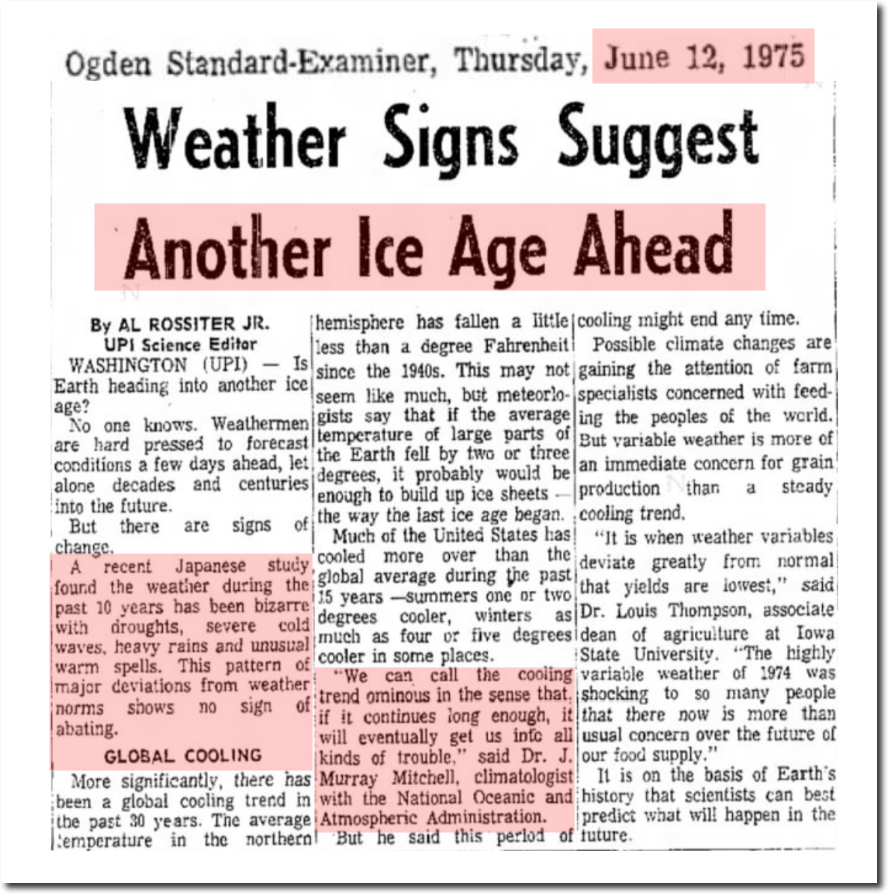
12 Jun 1975, Page 10 – The Ogden Standard-Examiner at Newspapers.com
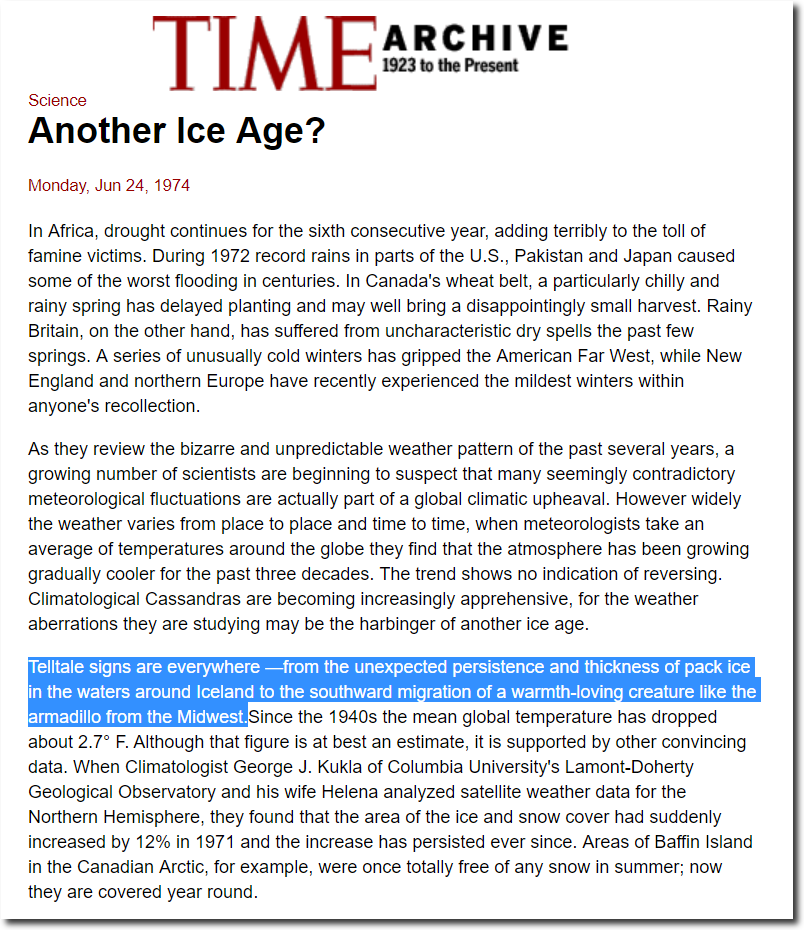
TIME Magazine Archive Article — Another Ice Age? — Jun. 24, 1974
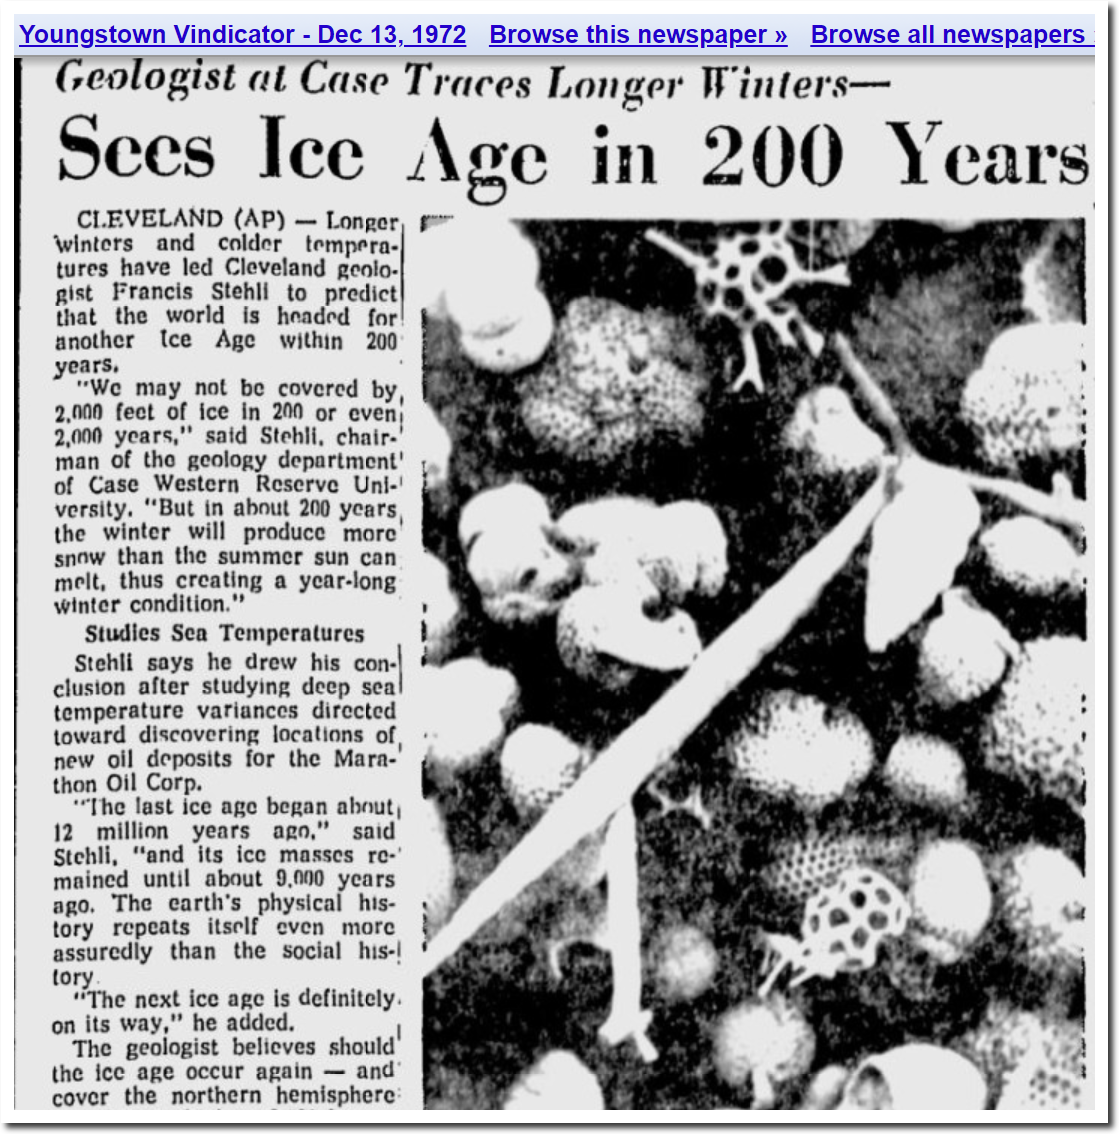
Youngstown Vindicator – Google News Archive Search
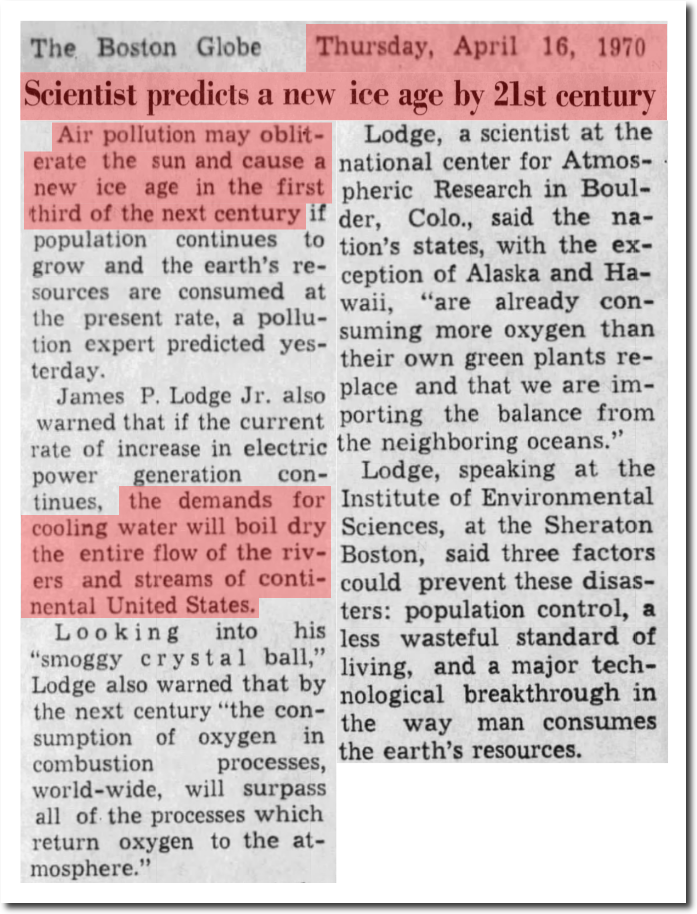
16 Apr 1970, 18 – The Boston Globe at Newspapers.com
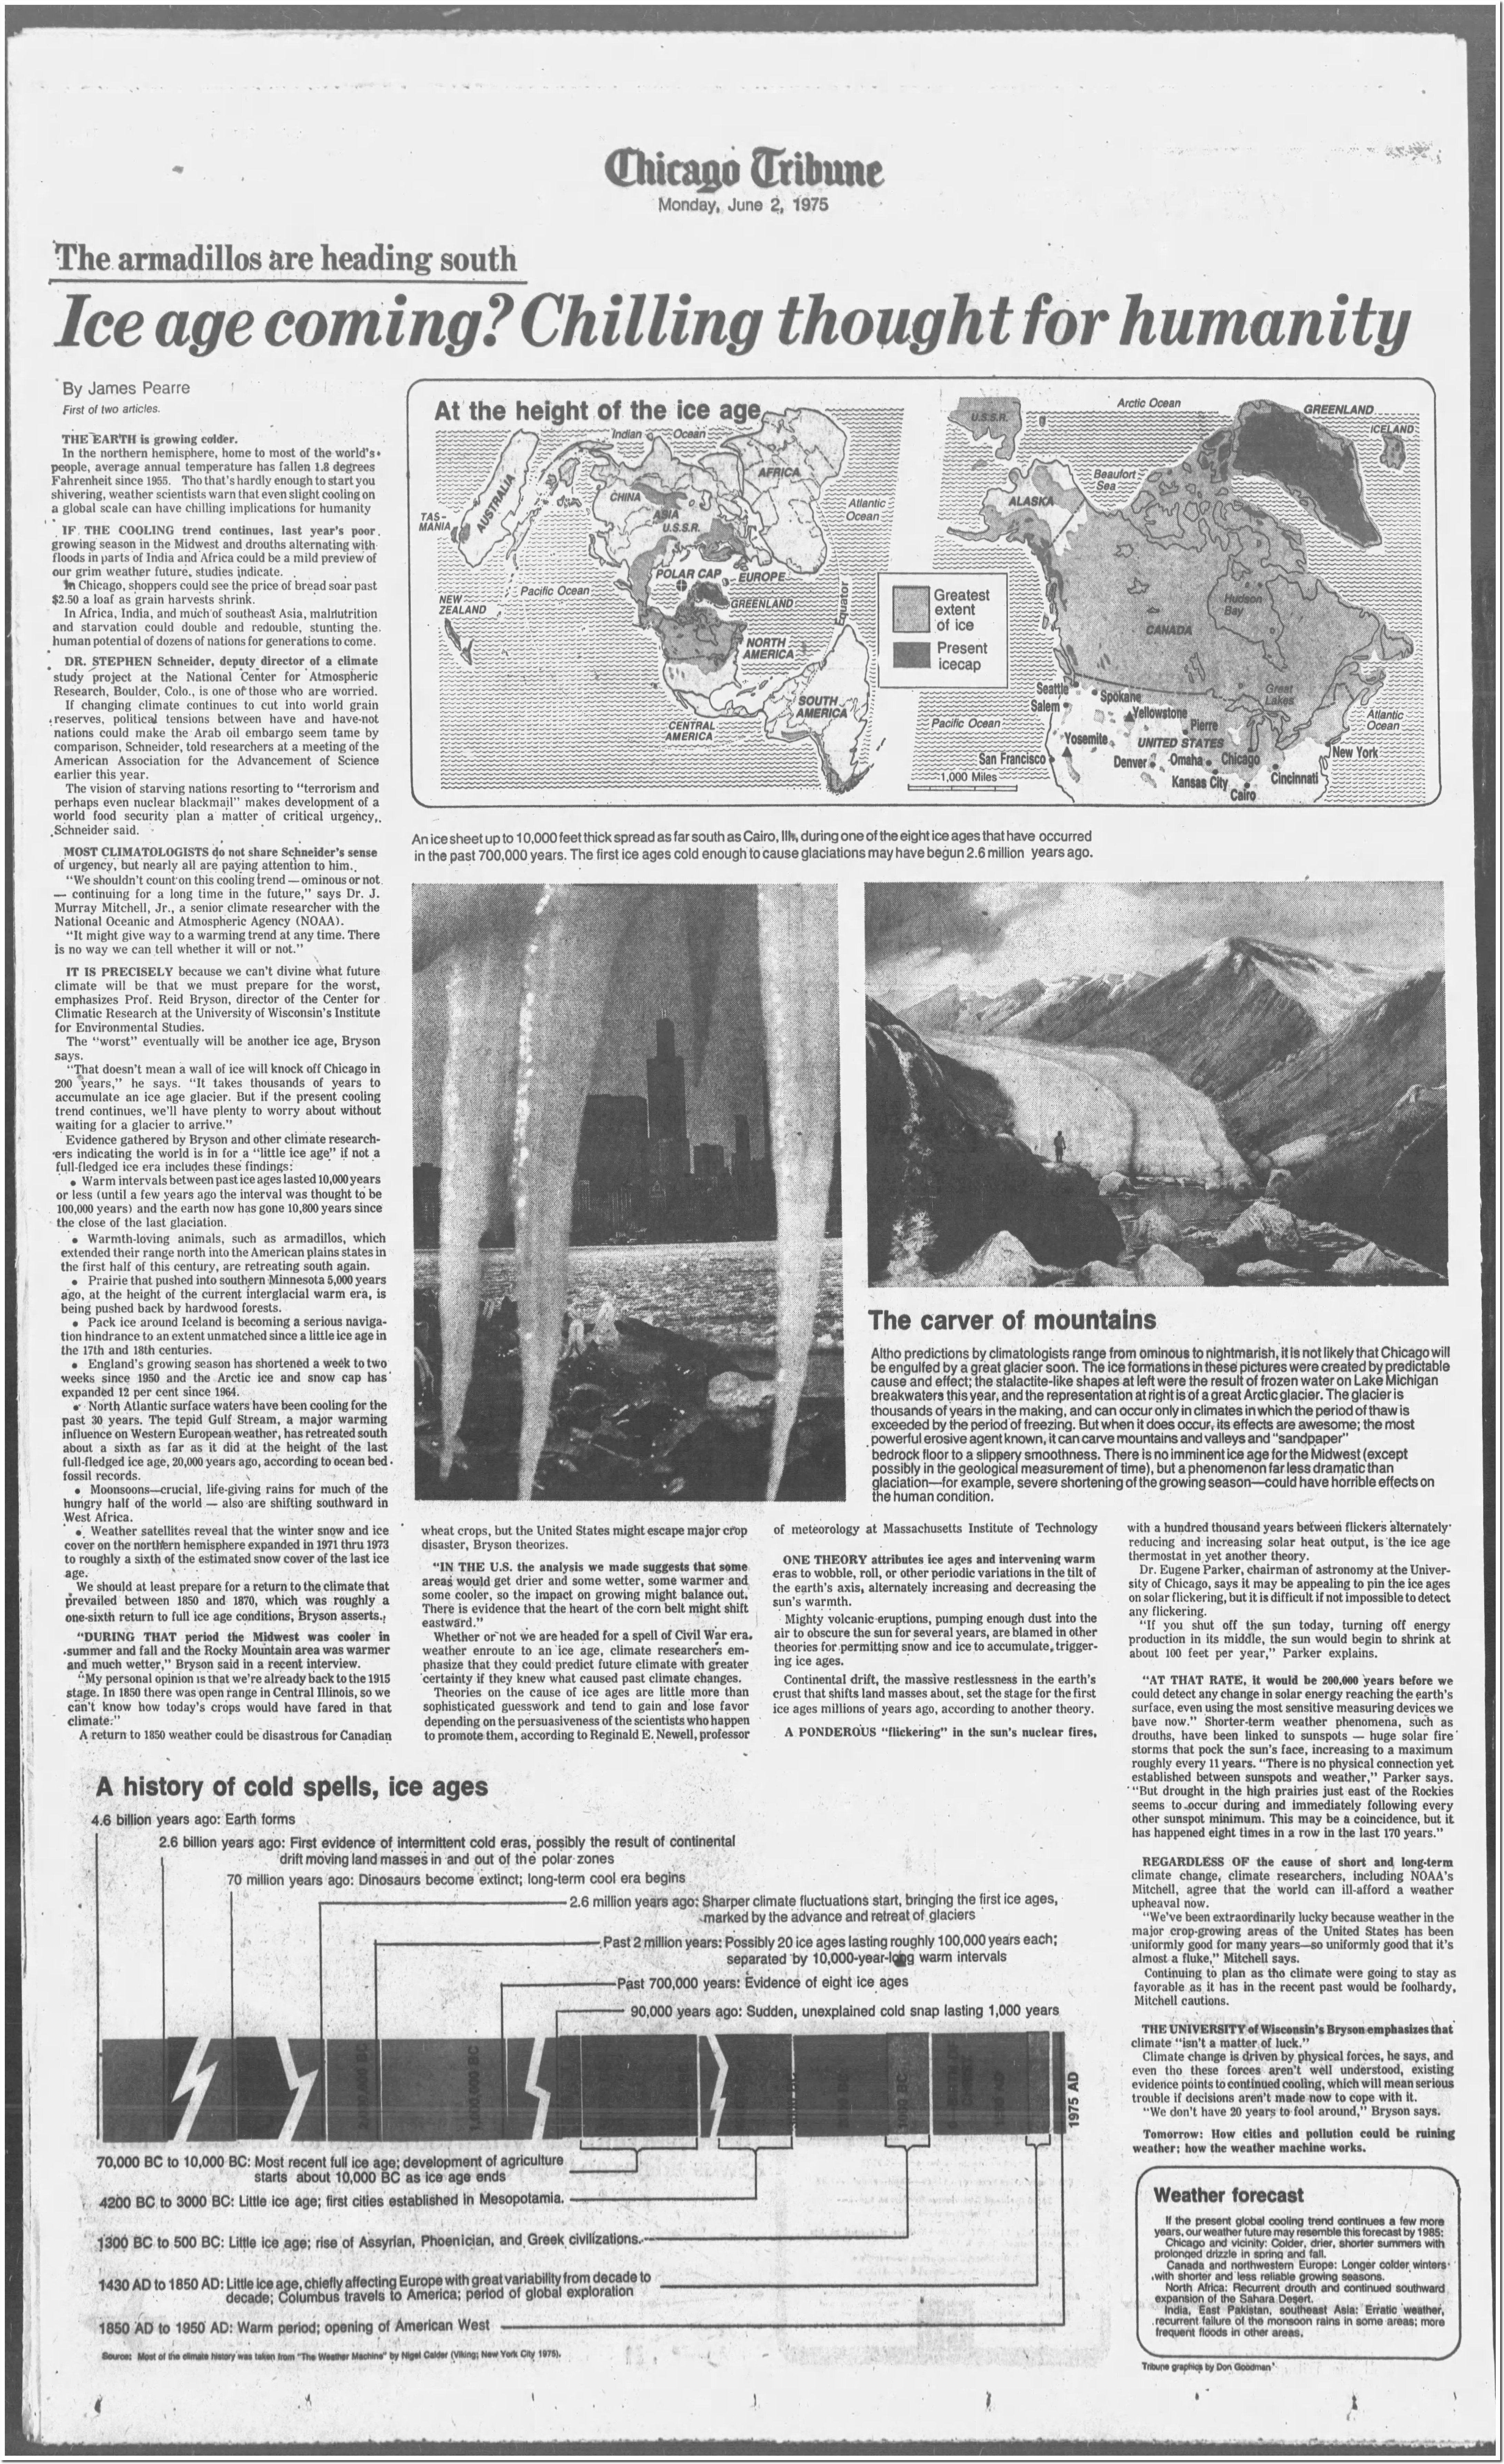
02 Jun 1975, 76 – Chicago Tribune at Newspapers.com
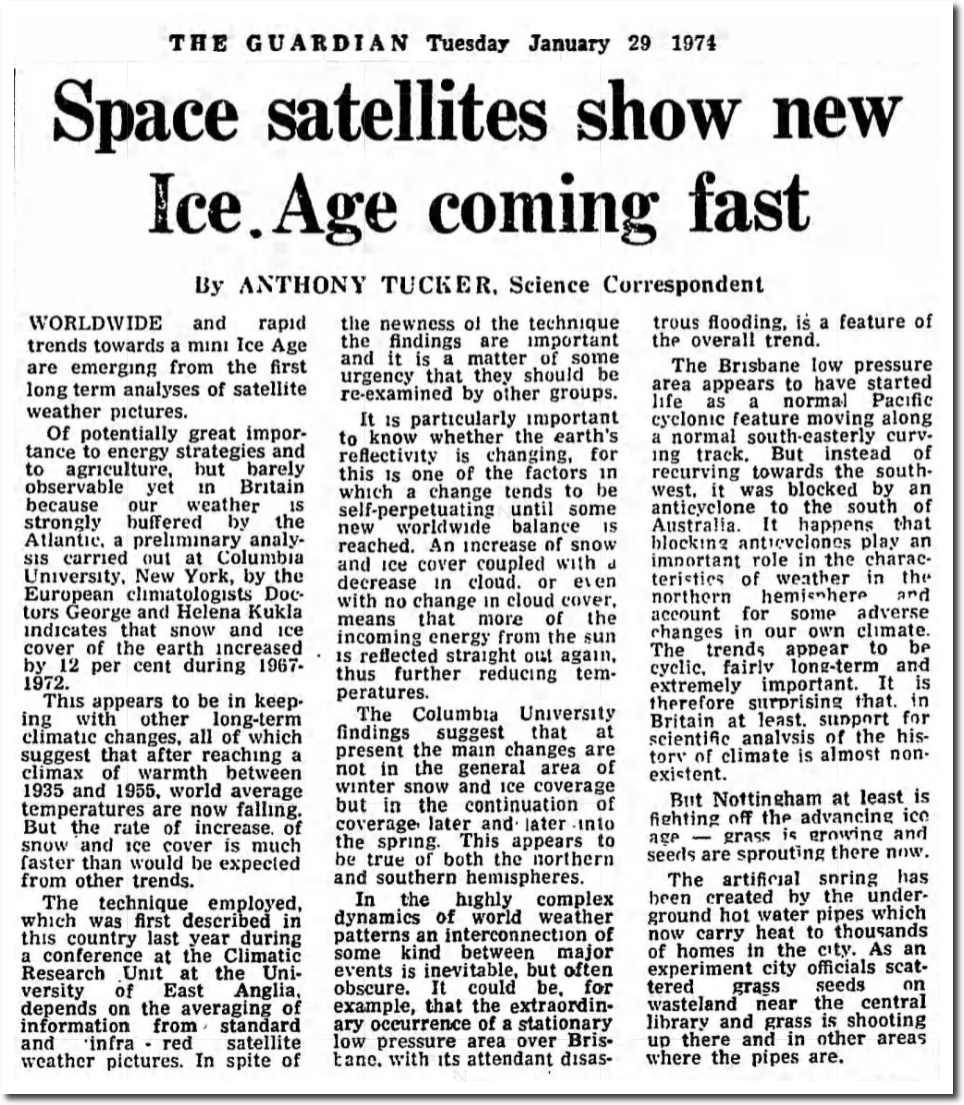
29 Jan 1974, 5 – The Guardian at Newspapers.com
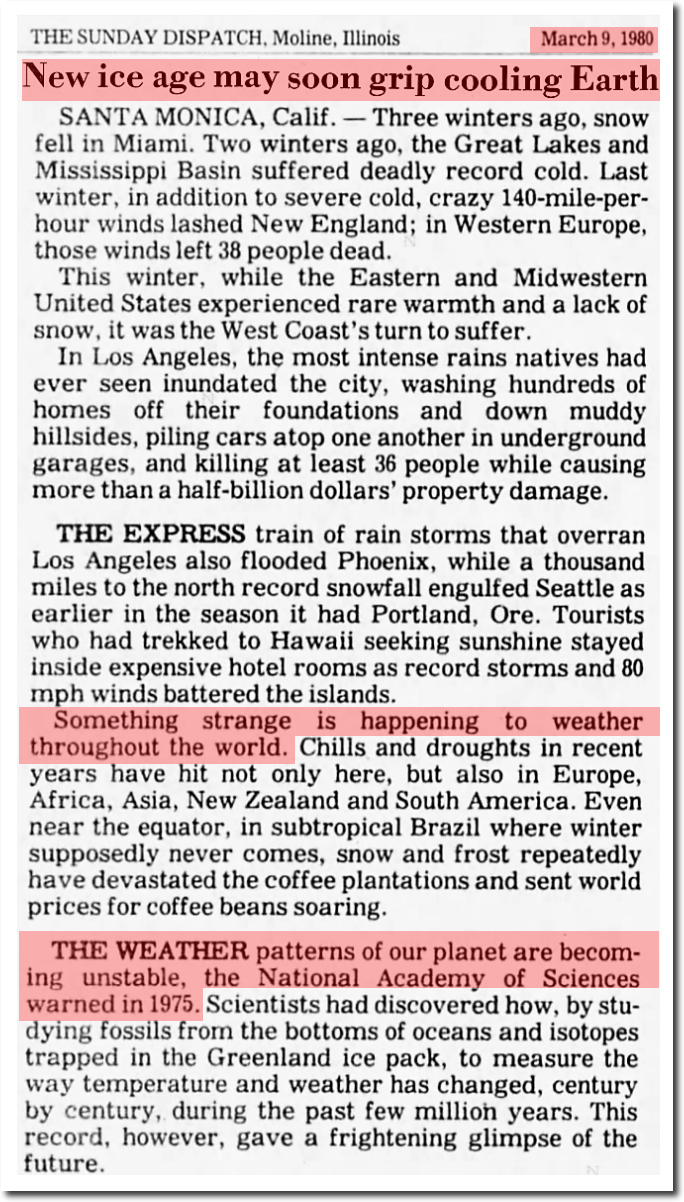
09 Mar 1980, 4 – The Dispatch at Newspapers.com
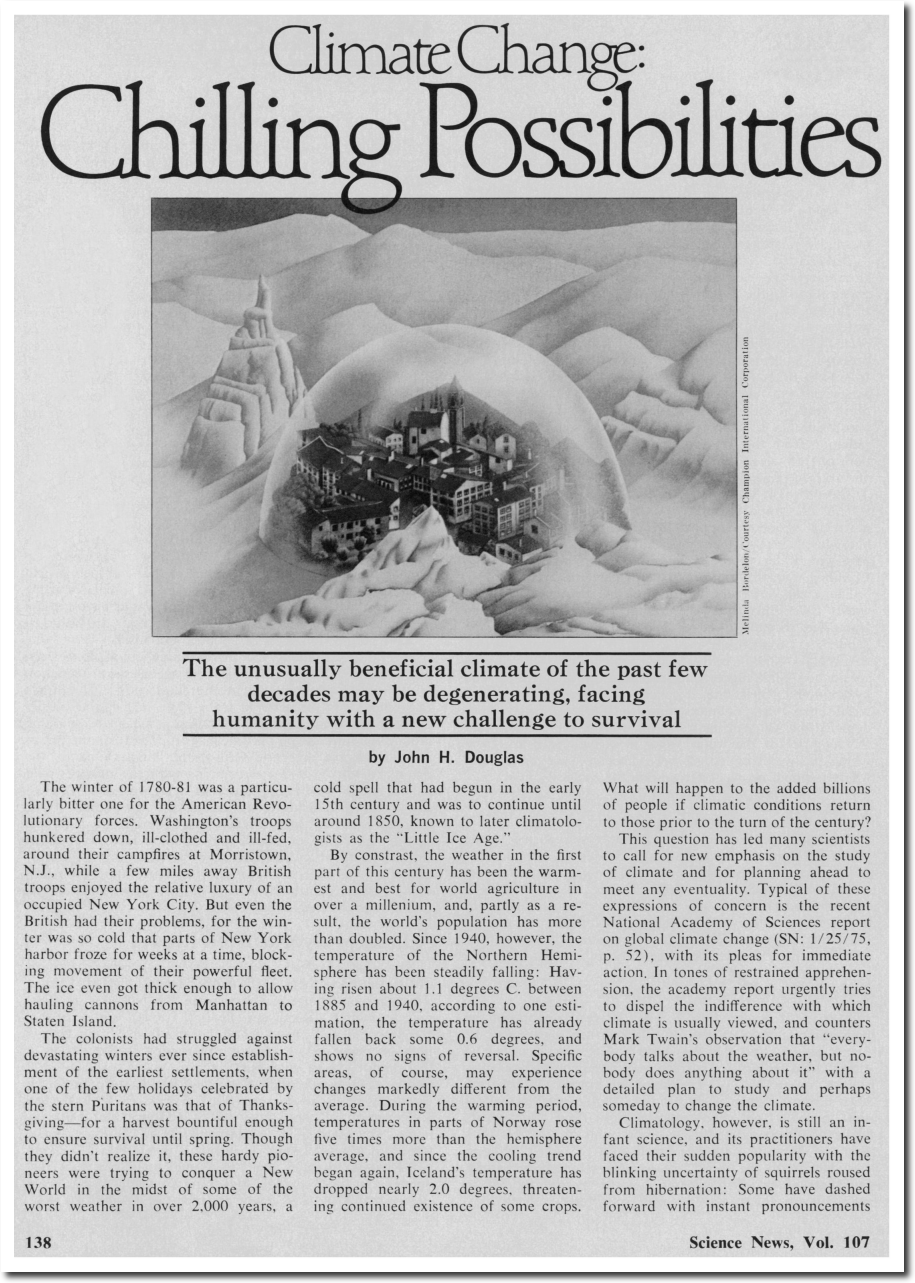
https://www.sciencenews.org/sites/default/files/8983
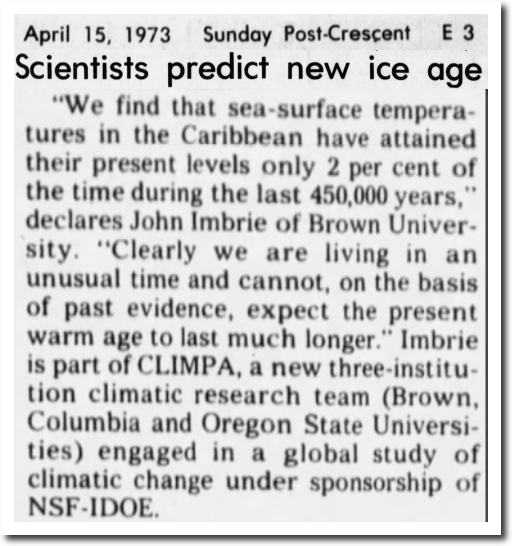
15 Apr 1973, 59 – The Post-Crescent at Newspapers.com
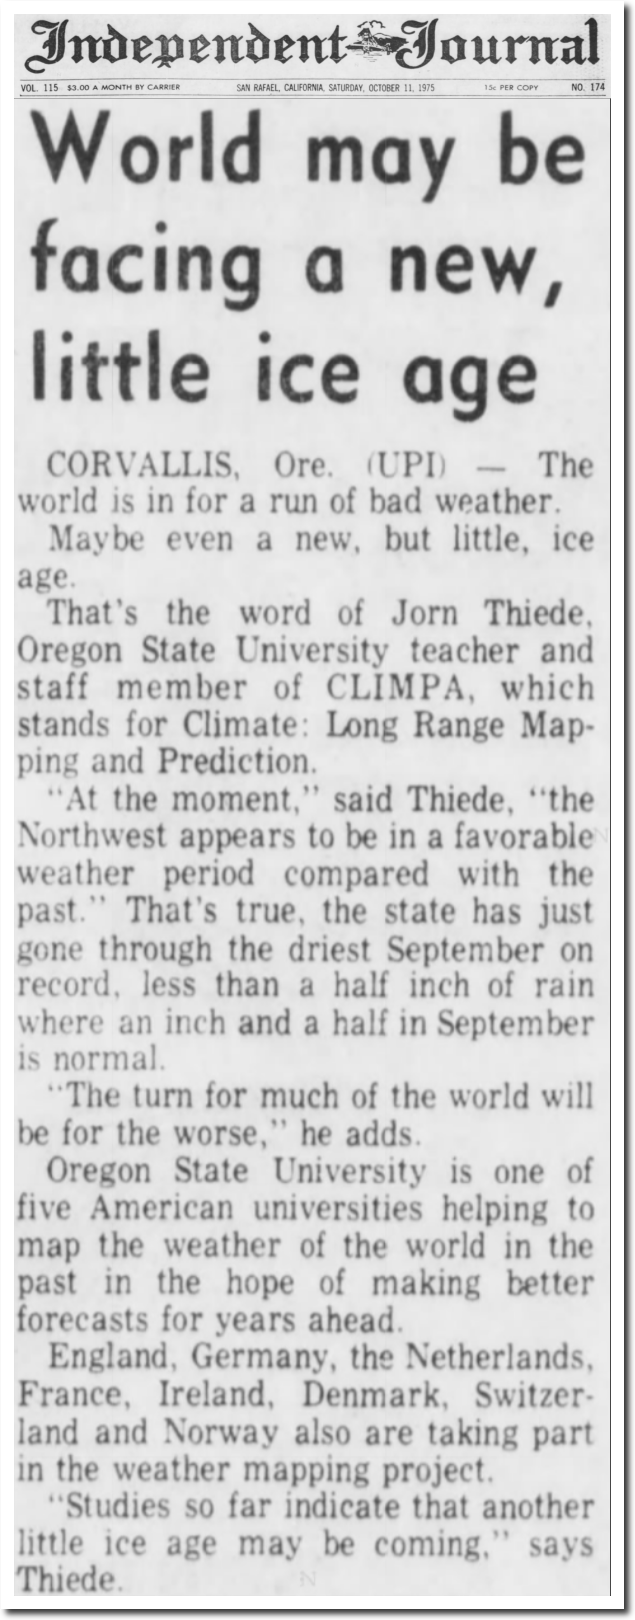
11 Oct 1975, Page 41 – Daily Independent Journal at Newspapers.com
14 Apr 1973, Page 8 – Iowa City Press-Citizen
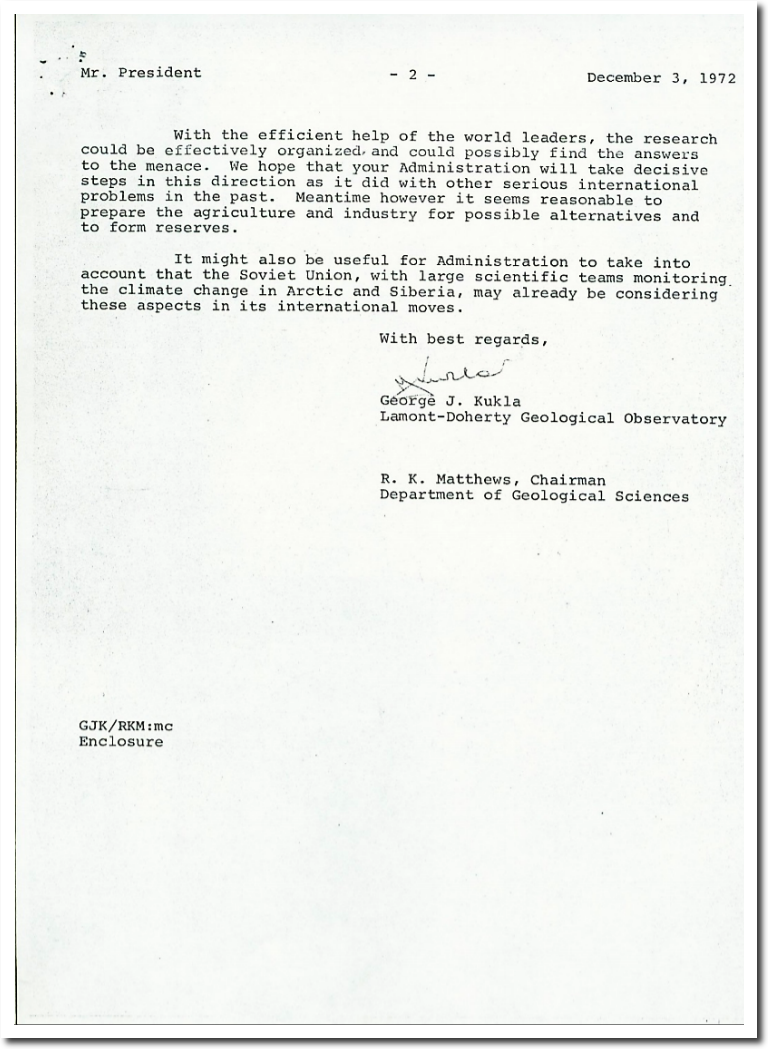
In 1972, the world’s leading climate experts wrote a letter to President Nixon warning of a new ice age “in about a century.”
THE ROLE OF NOAA’S CLIMATE PREDICTION CENTER IN THE DEVELOPMENT OF CLIMATE SERVICES
NASA predicted an ice age by the year 2020.
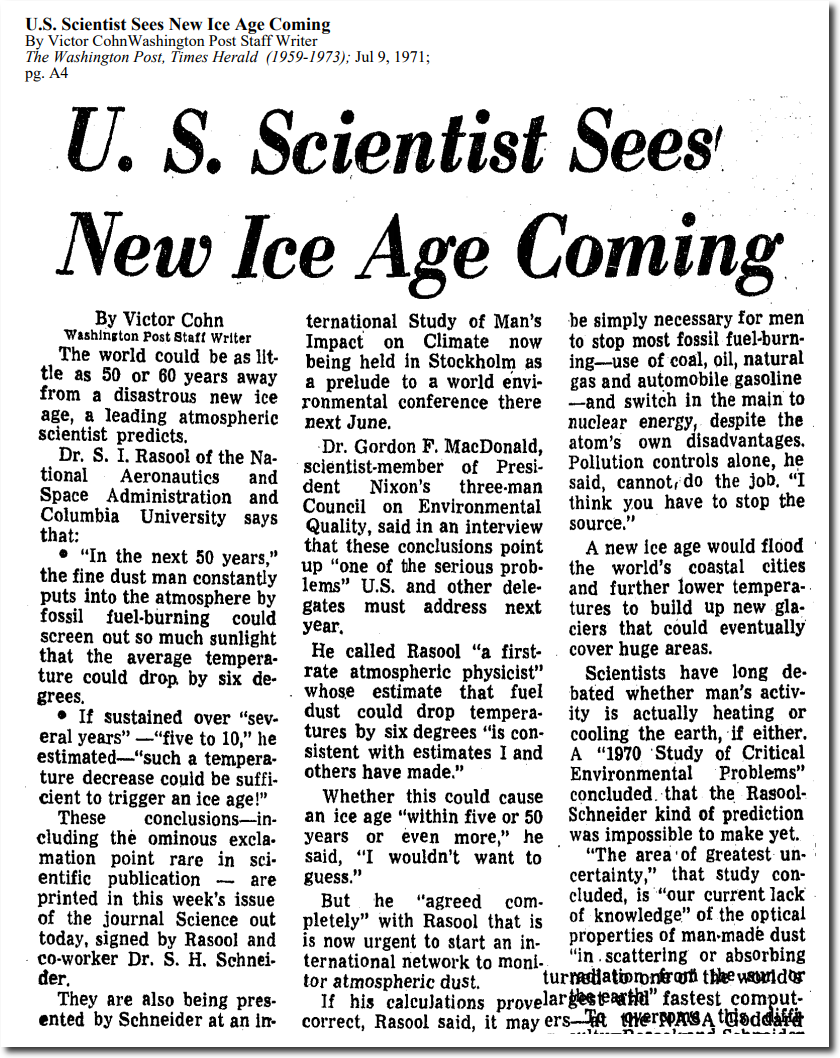
U.S. Scientist Sees New Ice Age Coming
It isn’t difficult to see why the 2018 National Climate Assessment chose to start their graph during the very cold 1960s, and hide all the hot weather prior to that. They are committing blatant fraud, deceiving the public, and telling a story which is the exact opposite of reality. This is exactly what President Eisenhower warned about in his 1960 farewell address. Scientists are attempting to seize control of policy.
In the councils of government, we must guard against the acquisition of unwarranted influence, whether sought or unsought, by the military-industrial complex. The potential for the disastrous rise of misplaced power exists and will persist.
We must never let the weight of this combination endanger our liberties or democratic processes. We should take nothing for granted only an alert and knowledgeable citizenry can compel the proper meshing of huge industrial and military machinery of defense with our peaceful methods and goals, so that security and liberty may prosper together.
Akin to, and largely responsible for the sweeping changes in our industrial-military posture, has been the technological revolution during recent decades.
In this revolution, research has become central; it also becomes more formalized, complex, and costly. A steadily increasing share is conducted for, by, or at the direction of, the Federal government.
Today, the solitary inventor, tinkering in his shop, has been over shadowed by task forces of scientists in laboratories and testing fields. In the same fashion, the free university, historically the fountainhead of free ideas and scientific discovery, has experienced a revolution in the conduct of research. Partly because of the huge costs involved, a government contract becomes virtually a substitute for intellectual curiosity. For every old blackboard there are now hundreds of new electronic computers.
The prospect of domination of the nation’s scholars by Federal employment, project allocations, and the power of money is ever present and is gravely to be regarded.
Yet, in holding scientific research and discovery in respect, as we should, we must also be alert to the equal and opposite danger that public policy could itself become the captive of a scientific-technological elite.
Our Documents – Transcript of President Dwight D. Eisenhower’s Farewell Address (1961)

It is interressting to see that the increase in heat waves during the ice age scare was of no relevance and had zero impact or weakening effect on global cooling,
but somehow the timeframe of the 60ies&70ies that was scientists ultimate prove for the coming ice became retroactivly the starting point of global warming.
This logic reminds of an old joke about latin american dictatorships
where a man walks his dog on a monday and gets beaten up by the police
for walking the dog
and on tuesday he gets beaten up by them because he walked without a dog.
Global warming alarmists are telling me, “those are just scary headlines, not real peer reviewed scientist papers” I keep pointing out these prophecies that have not come true, but they just deny deny deny the articles were meant to be taken seriously in the first place. Then claim, the actual science… The peer reviewed papers that appear in journals… do show the earth will warm up and we’ll all be on fire!!
This is lunacy!!
“…This is lunacy!!”
On the one hand, average people don’t know what CO2 even is or how photosynthesis works, they don’t know that H2O-vapor totally dominates any radiative downforcing, they don’t know how to read charts, they don’t know that sea levels are *not* accelerating, they don’t know that oceans have many layers with different temperatures that take 100’s of years to mix, they don’t know heat comes up at places of tectonic spreading, they don’t know how hot it was in recent history, etc etc.
On the other hand, you have the usual authoritarian scumbags trying to rule over their fellow man, and fear and self-righteous condemnation are the strongest impulses available to do that
You’re doing the work of 100 ‘real’ journalists. I’m beginning to wonder if you ever sleep
Keep busting these people
An amazing collection. Thanks.
~ ~ ~ ~ ~
Note the wording in the text just above the first chart:
“. . . Dust Bowl . . . with poor land management practices . . .”
To blame high temperatures in the United States on the situation in the region of the Dust Bowl is way beyond reason. And to top that, the 1930s are not shown in the chart.
Who writes this stuff, and where are the reviewers, and editors?
I finished this book a month or so ago:
“The Worst Hard Time: The Untold Story of Those Who Survived the Great American Dust Bowl” by Timothy Egan
If you are at all interested in US history, you should read it.
Also, read Egan’s “The Big Burn: Teddy Roosevelt and the Fire that Saved America
Tony,
Jo Nova has some details on the 1896 heatwave (1896 was also near the beginning of our Federation Drought – during the 1890’s and early 1900’s).
http://joannenova.com.au/2012/11/extreme-heat-in-1896-panic-stricken-people-fled-the-outback-on-special-trains-as-hundreds-die/
The Daily Mail also carries the story with some graphic old photos.
https://www.dailymail.co.uk/news/article-4221366/Heatwave-January-1896-hit-49-degrees-killed-437-people.html
I tweeted about this, but they did the same thing with acres burned in US. The NCA2018 shows acres burned starting in 2018. This like provides the data back to the 1920. https://www.nifc.gov/fireInfo/fireInfo_stats_totalFires.html
Orders of magnitude higher!
Yes, they did it with fires and Arctic sea ice.
Tony: I would like to interview you on my radio show. Are you available over the next few days?
Sure.
Thank you Tony. It’s no wonder none of the alarmists want to debate you, they wouldn’t stand a chance.
p.s. Look forward to your visiting the UK again. Will gladly buy you that pint 🙂
Tony,
Fantastic compilation! Sometimes I still get hung up sometimes when debating the fascist propaganda. Then when I read your posts, I think “that’s what I should have said.” I feel like Wayne and Garth when I read your brilliance – ‘We’re not worthy!’
It is way past the time for the lying, fraudulent felons to go to prison. Tony, you have indicted them!